
Fig. 3. Comparison of scFAN to seven other count matrix–based methods or open chromatin accessibility–based methods applied to the Corces dataset.
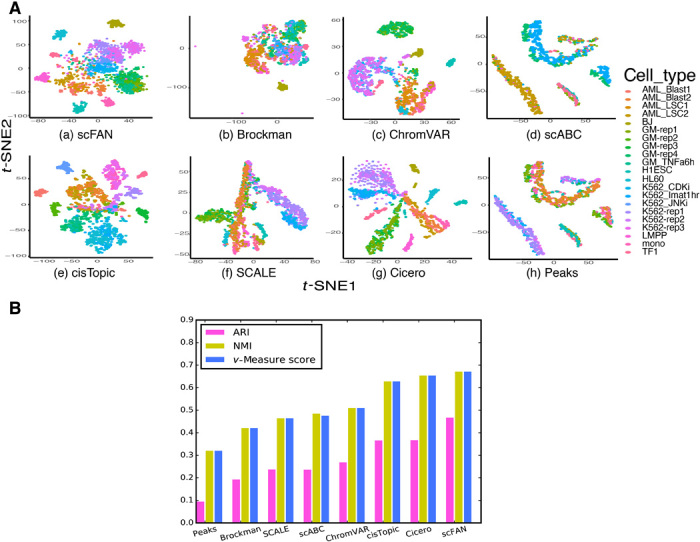
(A) t-SNEs of all seven different open chromatin–based or count matrix–based clustering methods. (B) Comparison of seven different clustering metrics of each method. ARI, NMI, and v-measure score were used to measure each method. The higher the score, the better the clustering performance.