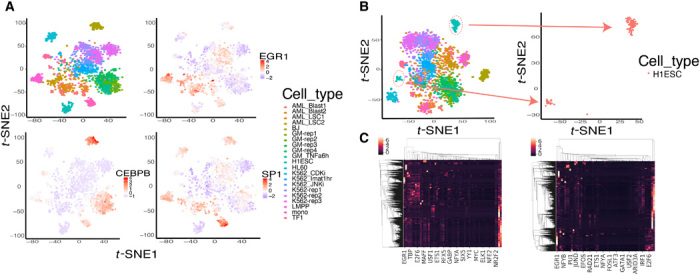
Fig. 5. TF activity score varies across cell types, and H1 cells are well separated by TF activity scores.

(A) TFs have varying activity scores across cell types. EGR1 is most active in the LMPP cells, CEBPB is most active in fibroblasts (BJ) cells, and SPI1 is most active in monocyte cells. (B) Separation of H1 embryonic stem cells (ESCs) colored red when using scATAC-seq as model input. The H1ESC cells clearly separated into two distinct groups (subclusters 1 and 2). (C) Heatmap plot of all the TFs and across the whole chromosome from one H1ESC cell. The left heatmap was generated by aggregated scATAC-seq data as input, and the right heatmap was generated by raw scATAC-seq data as input. The left heatmap contains more TF prediction information than the right plot.
