
Fig. 6. Clustering performance comparison when different thresholds and parameters are changed on the Corces dataset.
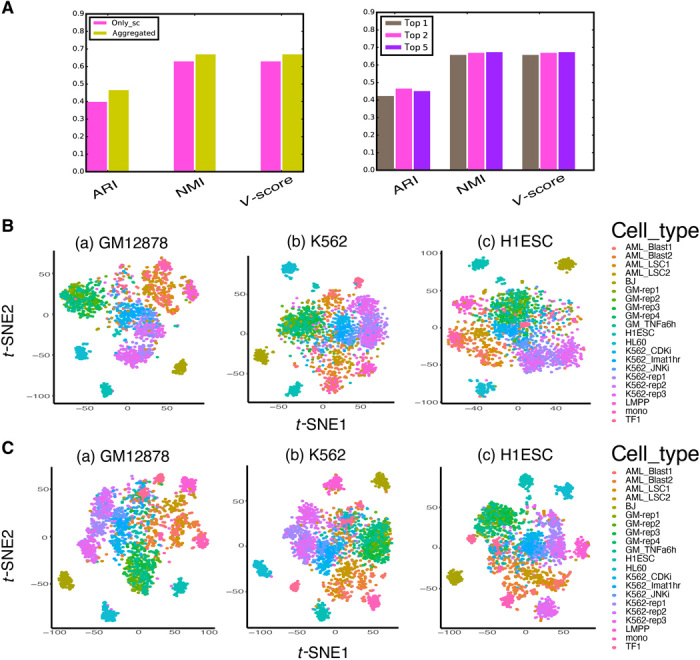
(A) Sensitivity of clustering to different ATAC-seq data that were used in the model and sensitivity of clustering to number of top TFs used. scFAN by default cluster cells on the aggregated ATAC-seq data and on the activity score of the top 2 most active TFs. (B) Clustering performance using three different pretrained models adopting scATAC-seq data as input. (C) Clustering performance using three different pretrained models adopting aggregated ATAC-seq data as input.