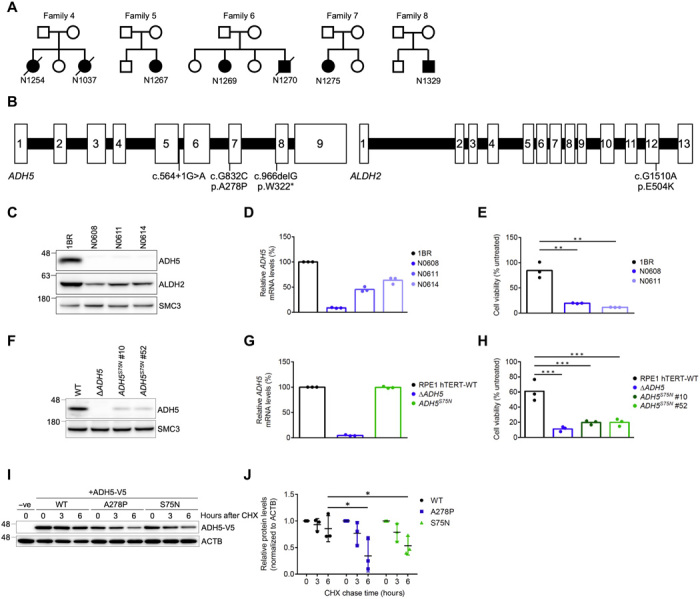
Fig. 1. Identification of digenic variants in ADH5 and ALDH2 in patients with AMeDS.

(A) Pedigrees of AMeDS families 4 to 8. (B) Pathogenic variants identified in ADH5 and ALDH2. (C) Immunoblots of ADH5 and ALDH2 in primary fibroblasts from normal (1BR) and patients with AMeDS (N0608, N0611, and N0614). SMC3 is a loading control. (D) ADH5 transcript of normal (1BR) and AMeDS (N0608, N0611, and N0614) cells. The relative transcript levels analyzed by the ∆∆CT method are shown for triplicate experiments. (E) Cell viability after continuous 30 μM formaldehyde treatment. Results from triplicate experiments (means ± SD) are shown. **P < 0.01, two-tailed unpaired t test. (F) Immunoblots showing a reduced stability of ADH5 p.S75N identified in a healthy individual, NAG16714. Gene-edited hTERT-immortalized RPE1 (RPE1 hTERT) cells expressing the homozygous ADH5 p.S75N alleles (clones no. 10 and no. 52), and ∆ADH5 cells are examined. (G) Stable expression of the p.S75N mRNA. (H) Cell viability after continuous 40 μM formaldehyde treatment. Results from triplicate experiments (means ± SD) are shown. ***P < 0.001, two-tailed unpaired t test. (I) ADH5 p.S75N is unstable as with p.A278P. U2OS cells transfected with V5-tagged ADH5 WT (wild type), p.A278P, or p.S75N were harvested at the indicated times following cycloheximide (CHX) treatment. Cell lysates were immunoblotted with V5 and ACTB antibodies. (J) Quantification of ADH5-V5 levels in (I) by image analysis, normalized to ACTB levels. Means (± SD) from triplicate experiments are shown. *P < 0.05; one-way analysis of variance (ANOVA) with Tukey’s multiple comparisons test.
