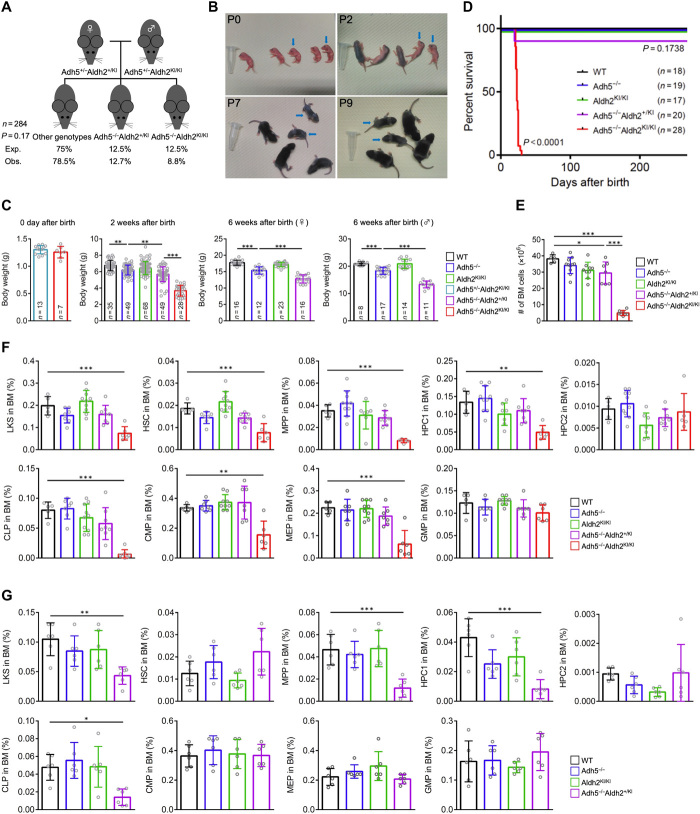
Fig. 4. Loss of Adh5 function in combination with reduced Aldh2 activity recapitulates the phenotype of AMeDS in mice.
(A) Observed and expected frequencies of mice at 2 weeks of age from intercrossed of Adh5+/−Aldh2+/KI female mice with Adh5+/−Aldh2KI/KI male mice. Chi-square test shows no significant difference between observed and expected (P = 0.17). (B) Postnatal growth defects of Adh5−/−Aldh2KI/KI mice. Representative pictures are shown. Blue arrows indicate Adh5−/−Aldh2KI/KI mice. Photo credit: Yasuyoshi Oka, Nagoya University. (C) Body weights of individual mice at 0 days, 2 weeks, or 6 weeks of age. **P < 0.01 and ***P < 0.001, one-way ANOVA with Tukey’s multiple comparisons test. (D) Kaplan-Meier curves with log-rank (Mantel-Cox) test show a significant decrease in survival of Adh5−/−Aldh2KI/KI compared to the mice with other genotypes (P < 0.0001). (E) Quantification of nucleated bone marrow cells in bilateral femurs and tibias from 3-week-old mice is shown (means ± SD; n = at least 5 animals). *P < 0.05 and ***P < 0.001; one-way ANOVA with Tukey’s multiple comparisons test. (F and G) Quantification of hematopoietic subset: LKS (Lin−c-Kit+Sca-1+), HSC (Lin−c-Kit+Sca-1+CD150+CD48−), MPP (Lin−c-Kit+Sca-1+CD150−CD48−), HPC1 (Lin−c-Kit+Sca-1+CD150−CD48+), HPC2 (Lin−c-Kit+Sca-1+CD150+CD48+), CLP (Lin−c-KitlowSca-1lowCD127+CD135+), CMP (Lin−c-Kit+Sca-1−CD34+CD16/32−), MEP (Lin−c-Kit+Sca-1−CD34−CD16/32−), and GMP (Lin−c-Kit+Sca-1−CD34+CD16/32+) in individual mice at 3 weeks of age in (F) and at 8 to 9 months of age in (G). Means ± SD; n = at least 5 animals. *P < 0.05, **P < 0.01, and ***P < 0.001, one-way ANOVA with Tukey’s multiple comparisons test.

