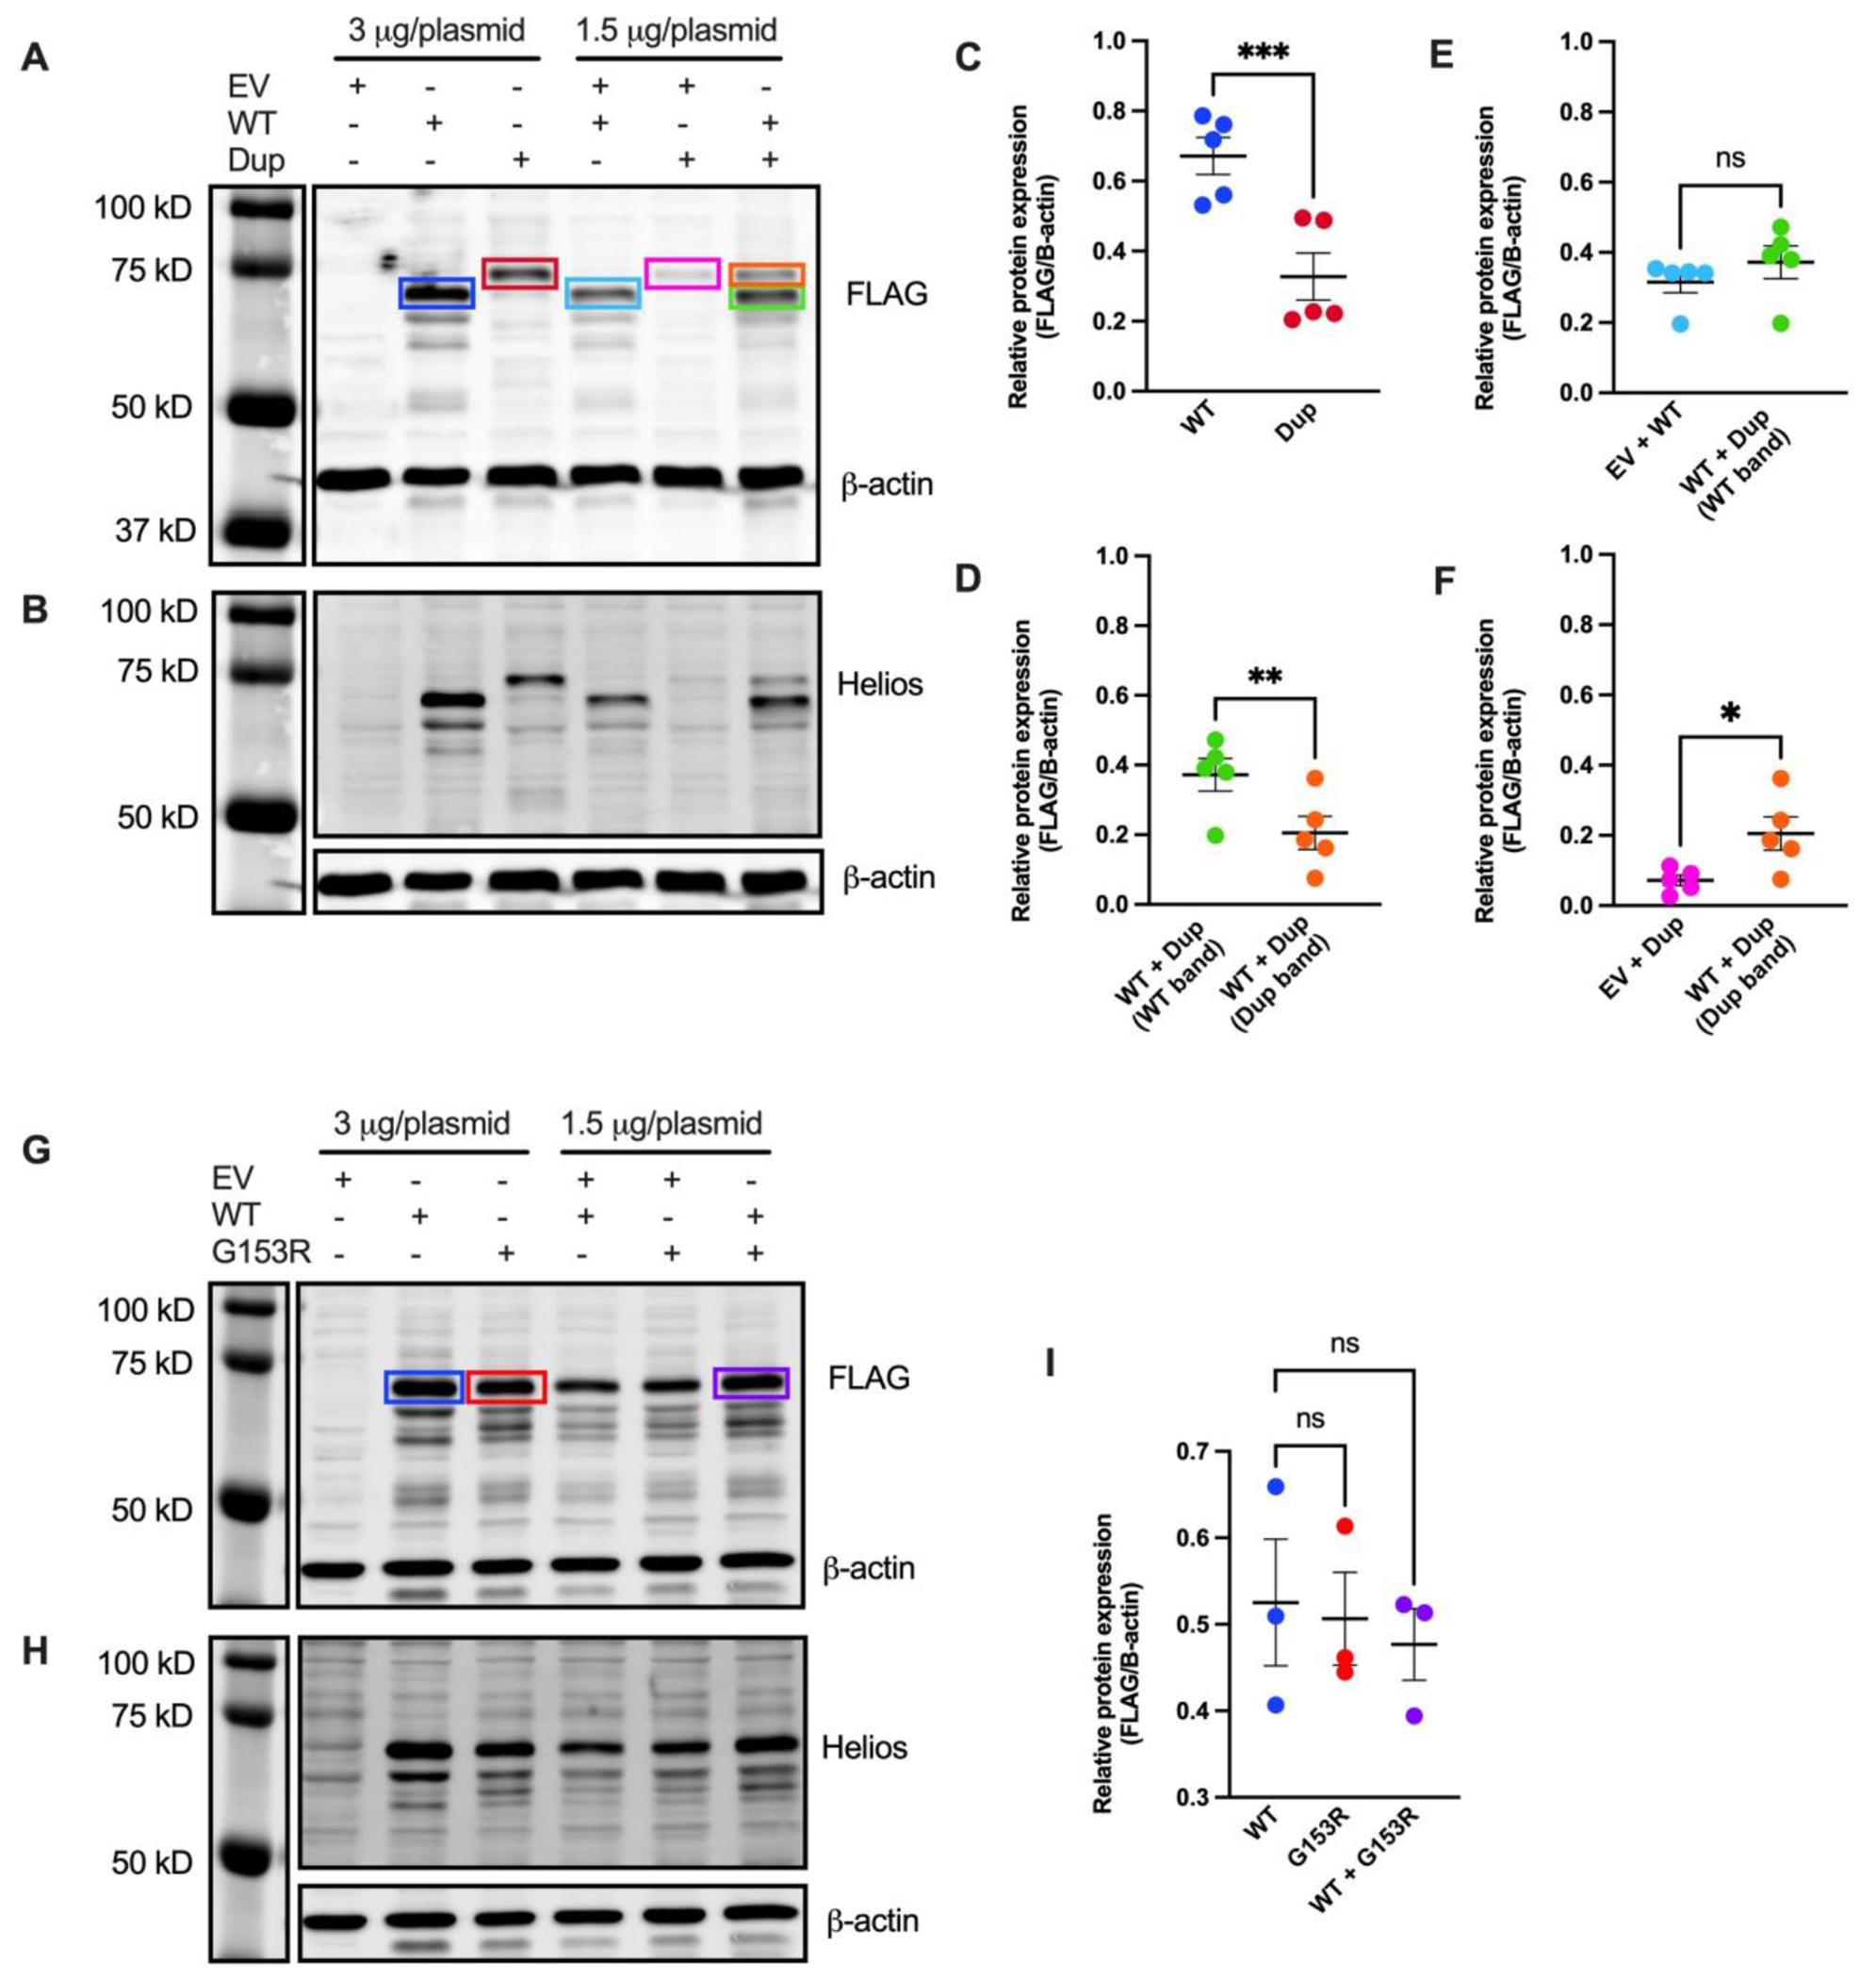
Figure 4. Assessment of variant protein expression in HEK293 cells.

(A and B) Immunoblot of lysates obtained from HEK293 cells transfected with with pCMV6-XL4 plasmids expressing FLAG-tagged wild-type IKZF2 (WT), p.Gly136_Ser191dup variant (Dup), and/or empty vector control (EV). Protein was detected using anti-FLAG antibody in A and anti-Helios antibody in B. An anti-β actin antibody was used as loading control. A, B are representative blots from five independent experiments. (C, D, E and F) Band intensities of FLAG and β-actin fluorescence signals were quantified using Image Studio™ Lite Quantification Software (Licor). Data presented are mean ± SEM from five independent experiments. Paired two-tailed t-test was used for statistical analysis: *p≤ 0.05; **p ≤ 0.01; ***p ≤ 0.001. (G and H) Immunoblot of lysates obtained from HEK293 cells transfected with pCMV6-XL4 plasmids expressing FLAG-tagged WT IKZF2, p.Gly153Arg (G153R), and/or EV. Protein was detected using anti-FLAG antibody in G and anti-Helios antibody in H. An anti-β-actin antibody was used as loading control. G and H are representative blots from three independent experiments. (I) Quantification of band intensities of FLAG and β-actin fluorescence signals using Image Studio™ Lite. Data presented are mean ± SEM from three independent experiments. Paired two-tailed t-test was used for statistical analysis; ns, not significant.
