. 2024 May 22;15(25):9793–9805. doi: 10.1039/d4sc02315c

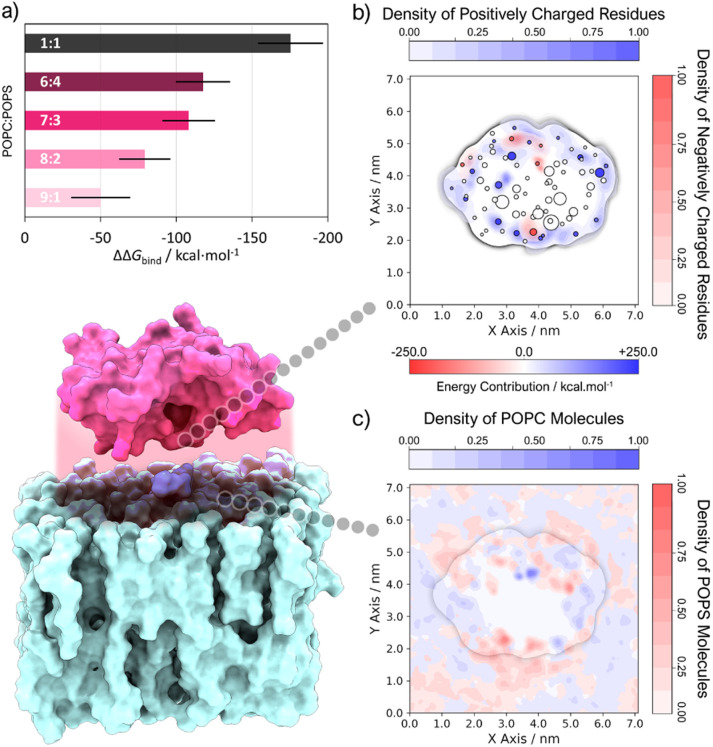
Fig. 2. (a) ΔΔGbind of systems with different POPC : POPS composition, calculated relative to a pure POPC system (standard deviation is represented by a black line). (b) 2D density contour (perpendicular to the z axis, see ESI S4 for more details) of charged amino acid residues overlayed with a scatter plot of residues closest to phospholipid molecules, where the color and size of the markers are scaled with the energy contribution to binding (calculated with the MM-PBSA method) and the membrane penetration depth (Δz) of the residue center of geometry (cog), respectively. (c) Overlay of 2D density contours (perpendicular to the z axis, see ESI S4 for more details) of phosphate atoms belonging to either POPC or POPS.

Fig. 2