. 2024 May 22;15(25):9793–9805. doi: 10.1039/d4sc02315c

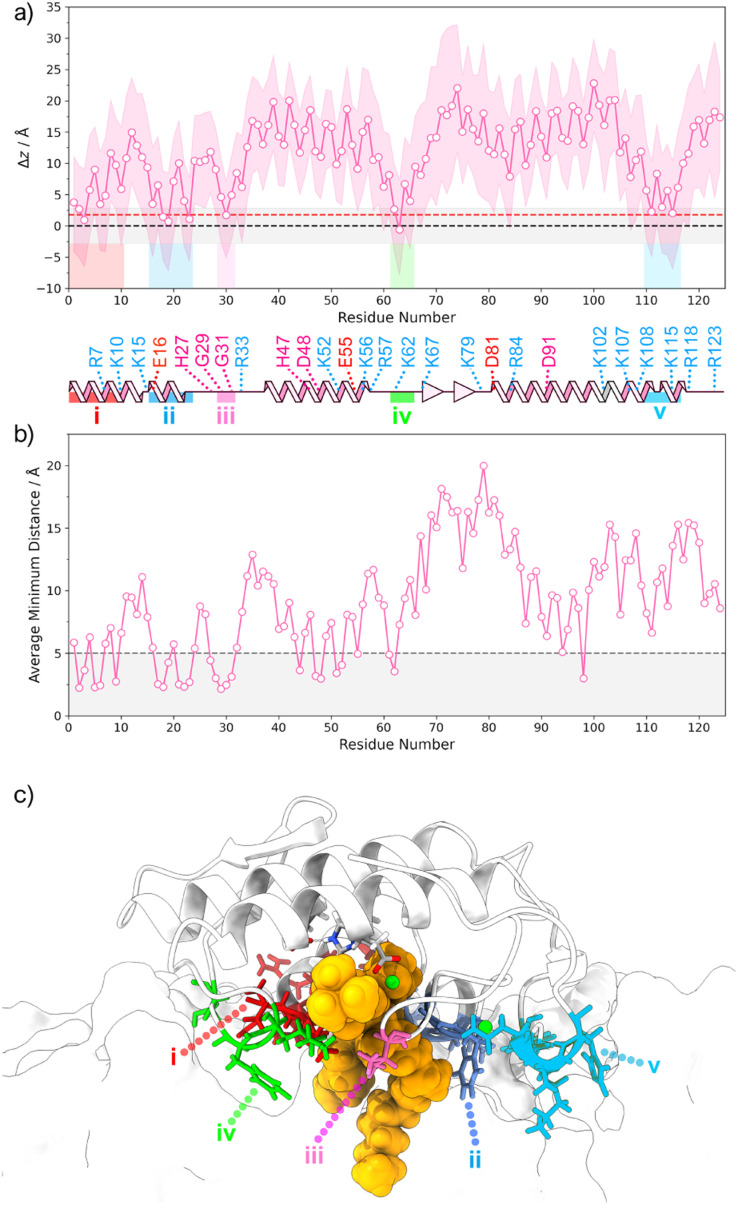
Fig. 3. (a) Average (pink line), minimum and maximum (shaded pink band) membrane penetration depth Δz of protein residues relative to the z axis. The membrane penetration depth is defined as the distance between the average z coordinates of P atoms in the upper-leaflet (i.e., black dashed line) and the average z coordinate of the center of geometry (cog) for each residue. The standard deviation of the average z coordinates of P atoms in the upper-leaflet is represented as a shaded grey band, and the average z coordinates of headgroup atoms is represented as a red dashed line. (b) Average minimum distance between each residue and the POPC substrate molecule. The dashed line at 5 Å is a cutoff that distinguishes the closest shell of residues from the rest and was defined after a histogram analysis. (c) Representation of the residue hotspots identified to be buried deep (maximum depth is lower than the x̄-σ of the z coordinates of P atoms) in the bilayer.

Fig. 3