. 2024 May 22;15(25):9793–9805. doi: 10.1039/d4sc02315c

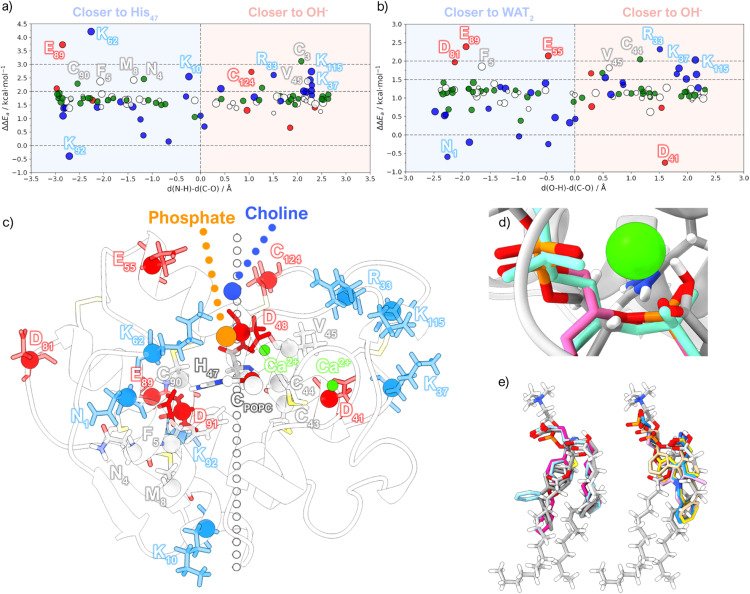
Fig. 6. Contribution of individual residues to the energy barrier obtained from the CI-NEB calculations for the (a) single-water and (b) assisting-water reaction pathways. The energies are plotted against the d(N–O)-d(C–O) and d(O–H)-d(C–O) distance differences, respectively, which represent a plane that divides the protein into two regions: either closer to the proton-receiving base or closer to the proton donating acid. The marker color represents the amino acid classification (negatively charged – red; positively charged – blue; polar – green; apolar – white), and the marker size represents the volume. (c) Representation of the TS obtained with the single-water mechanism showing the residues identified in (a) and (b) (negatively charged – red; positively charged – blue; non-charged – grey). (d) Overlap of the single-water transition state structure obtained with the CI-NEB method (grey) and structures of a known substrate/transition-state analog present in the PDB complexes 1MKV (pink) and 1POE (aquamarine), focusing on the bond forming/breaking region. (e) Overlap of the single-water transition state structure obtained with the CI-NEB method (grey) and known inhibitors/analogs (PDB codes: 5G3N, 3U8H, 3U8D, 1KVO, 1KQU, 1J1A, 1DCY and 1DB5).

Fig. 6