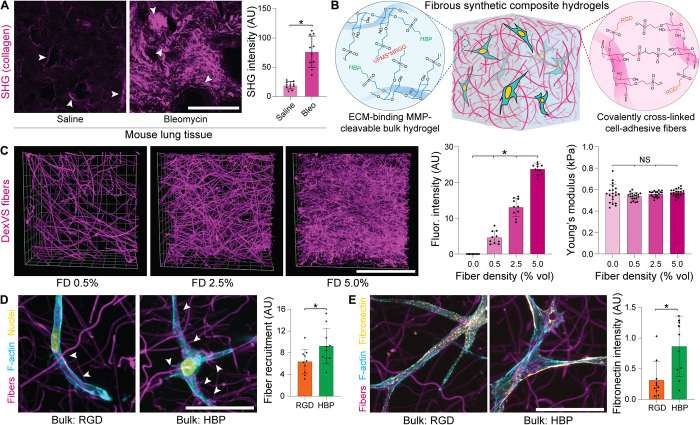
Fig. 2. Microengineered fibrous hydrogel composites to model the lung interstitium.
(A) SHG imaging of collagen microstructure within healthy and bleomycin-treated lungs on day 14, with quantification of average signal intensity (arrows indicate interstitial tissue regions adjacent to alveoli; n = 3 mice per group, n = 10 fields of view per group; scale bar, 100 μm). (B) Schematic depicting polymer cross-linking and functionalization for generating fibrous DexVS hydrogel composites to model changes in fiber density within lung interstitial tissue ECM. (C) Images and intensity quantification of fluorophore-labeled fibers within composites varying in fiber density (n = 4 samples per group, n = 10 fields of view per group; scale bar, 100 μm). Young’s modulus determined by AFM nanoindentation of fibrous composites formed with different concentrations of VPMS cross-linker (n = 4 samples per group, n = 20 measurements per group). (D) Representative high-resolution images of NHLFs on day 1 in fibrous composites formed with bulk hydrogels (12.5 mM VPMS) functionalized with integrin ligand arginylglycylaspartic acid (RGD) or heparin-binding peptide (HBP) [F-actin (cyan), nuclei (yellow), and DexVS fibers (magenta); scale bar, 50 μm]. Quantification of fiber recruitment as measured by contact between cells and DexVS fibers (n = 10 fields of view per group, n > 25 cells analyzed). (E) Representative high-resolution images of NHLF on day 1 fibrous composites formed with bulk hydrogels functionalized with integrin ligand RGD or HBP [F-actin (cyan), fibronectin (yellow), and DexVS fibers (magenta); scale bar, 5 μm]. Quantification of fibronectin deposition into tshe hydrogel matrix as measured by immunostain intensity (n = 10 fields of view per group, n > 25 cells analyzed). All data presented are means ± SDs with superimposed data points; asterisk denotes significance with P < 0.05 determined by one-way ANOVA or Student’s t test, where appropriate; NS denotes nonsignificant comparison.

