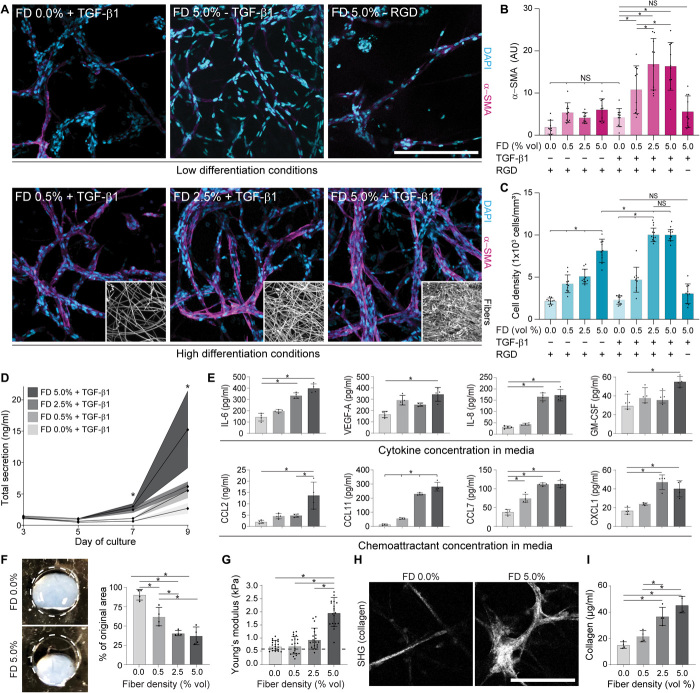
Fig. 4. Profibrotic soluble and physical cues promote MF differentiation in 3D and initiate a progression of fibrosis-associated changes over long-term culture.
(A) Representative immunofluorescence images of NHLFs in microenvironmental conditions leading to low (top row) or high (bottom row) MF differentiation after 9 days in culture [α-SMA (magenta) and nuclei (cyan); n = 4 samples per group, n = 10 fields of view per group, and n > 50 cells per field of view; scale bar, 200 μm], with corresponding image-based quantification in (B) and (C). Insets depict representative fiber densities. (D) Measurement of total cytokine secretion over time as a function of fiber density (n = 4 samples per condition; * indicates significant differences between FD 5.0% and all other groups at a given time point; NS denotes nonsignificant comparison). (E) Secretion of specific cytokines and chemoattractants as a function of fiber density on day 9 (n = 4 samples per condition). (F) Representative images and quantification of tissue contraction within day 14 fibroblast-laden hydrogels of varying fiber density (n = 4 samples per group, dashed line indicates initial diameter of 5 mm). Photo credit: Daniel Matera, University of Michigan. (G) AFM measurements of day 14 fibroblast-laden hydrogels of varying fiber density (n = 20 measurements from n = 4 samples per group). Dashed line indicates original hydrogel stiffness. (H) SHG images of fibrous collagen within fibroblast-laden hydrogels after 21 days of culture in medium supplemented with ascorbic acid (scale bar, 100 μm). (I) Measurement of total collagen content within digested DexVS hydrogels at day 21 as measured by biochemical assay (n = 4 samples per group). All data presented are means ± SDs with superimposed data points; asterisk denotes significance with P < 0.05 determined by one-way ANOVA; NS denotes nonsignificant comparison.

