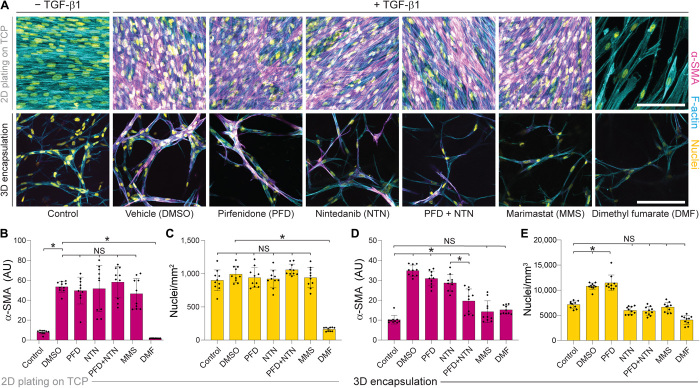
Fig. 5. Pharmacologic treatment of NHLFs plated on tissue culture plastic in 2D compared to encapsulated within 3D fibrous hydrogels reveals differential drug responses.
(A) Representative confocal images stained for α-SMA (magenta), F-actin (cyan), and nuclei (yellow) of NHLFs after 9 days of culture on tissue culture plastic (TCP) (top row) or 3D fibrotic matrices (bottom row) with pharmacologic treatment indicated from days 3 to 9 (scale bar, 100 μm). Imaged regions were selected to maximize the number of α-SMA+ cells per field of view within each sample. (B) Quantification of α-SMA and (C) total cell count within 2D NHLF cultures. (D) Quantification of α-SMA and (E) total cell count within 3D fibrotic matrices (n = 4 samples per group, n = 10 fields of view per group, and n > 50 cells per field of view). All data presented are means ± SDs with superimposed data points; asterisk denotes significance with P < 0.05 determined by one-way ANOVA; NS denotes nonsignificant comparison.

