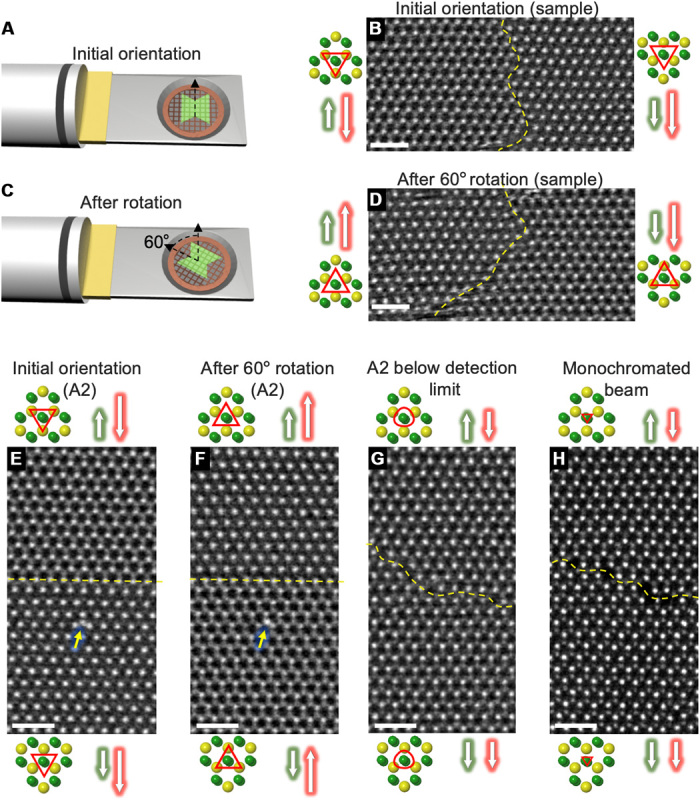
Fig. 3. Experimental observations of RMC in HR-STEM ADF imaging.

(A to D) Sample rotation experiment: HR-STEM ADF imaging taken at regions in close proximity to the interface between MoS2 mirror grains with an antiphase (60°) growth mismatch. Schematic representation of the relative position of sample supported on TEM holder before and after rotation is illustrated in (A) and (C). Corresponding HR-STEM ADF images before and after an in-plane rotation by 60° are shown in (B) and (D). The experimental observation agrees very well with the QSTEM simulation results as is evident by the atomically resolved phase transition after A2 rotation. (E to H) A2 rotation experiment: Cs-corrected HR-STEM ADF imaging of the interface between a monolayer MoS2 grains with antiphase (60°) growth mismatch. (E and F) Images at the same spot of the interface before and after A2 = 100-nm rotation by 60°, correspondingly. Atomic models (yellow for Mo and green for S) and arrows (green for sulfur and red for A2) suggest A2 orientation based on the simulation in Fig. 2. (G) Image of the interface for A2 reduced below the detection limit, and (H) additionally, monochromated beam (60-meV energy spread) was used. Scale bars, 1 nm.
