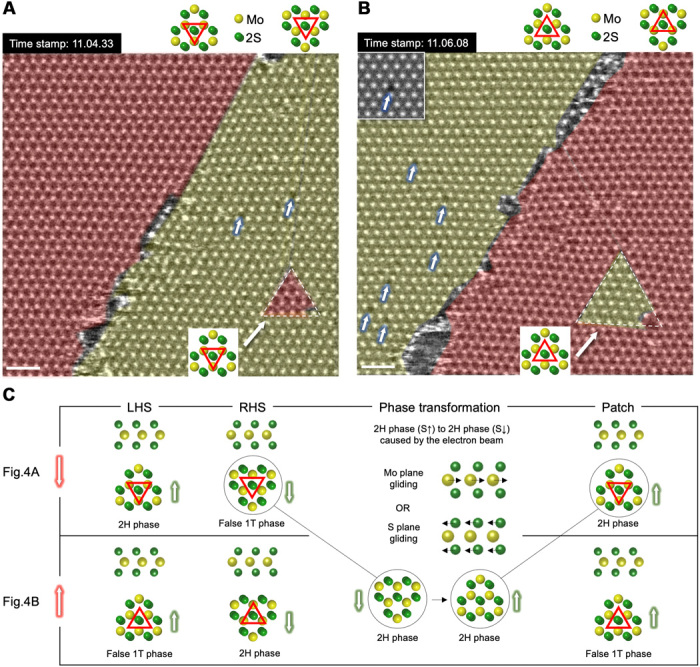
Fig. 4. Electron beam–induced local transition of embedded patch inside MoS2 matrix.

False-colored HR-STEM ADF images at a mirror grain boundary. (A) Before and (B) after A2 = 100 nm and rotating by 60°, respectively. Color coding is used to distinguish regions with 2H (red) and false 1T (yellow) types of contrast, caused by (A2↓ - S↑) and (A2↑ - S↑) imaging configuration, respectively. Red and yellow triangles in (A) and (B) show the growing 2H (S↑) transition region in 2H (S↓) matrix. Note that white arrows denote double S vacancy sites. The inset in (B) shows the simulation of false 1T contrast of MoS2 film with a double S vacancy in the center. Scale bar, 1 nm. (C) Schematic representations reveal the root cause of contrast formation in both (A) and (B).
