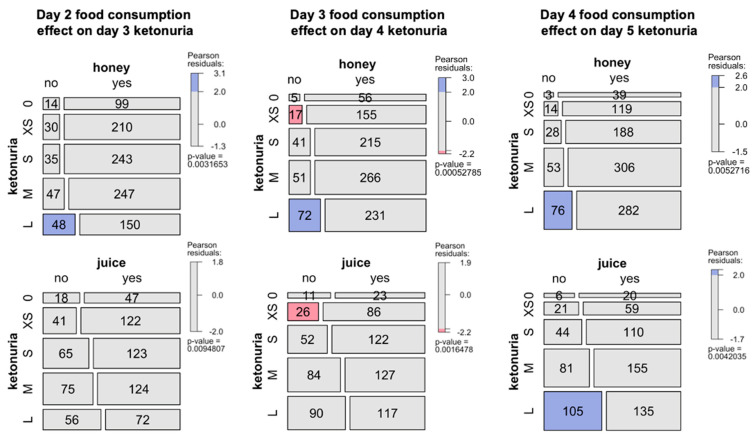
Figure 4.
Influence of food consumption during fasting in the cohort of 1610 patients. Effects of the consumption of honey and juice during the second, third, or fourth day of fasting and its effects on next day ketonuria (0, none, XS, traces; S, small; M, medium; L, large). The mosaic plot shows an area-proportional visualization of observed frequencies. The p-value is computed from a Chi-squared distribution. Shadings for the contingency tables indicates the Pearson residuals, reflecting to which extent the observed values deviate from expected values.

