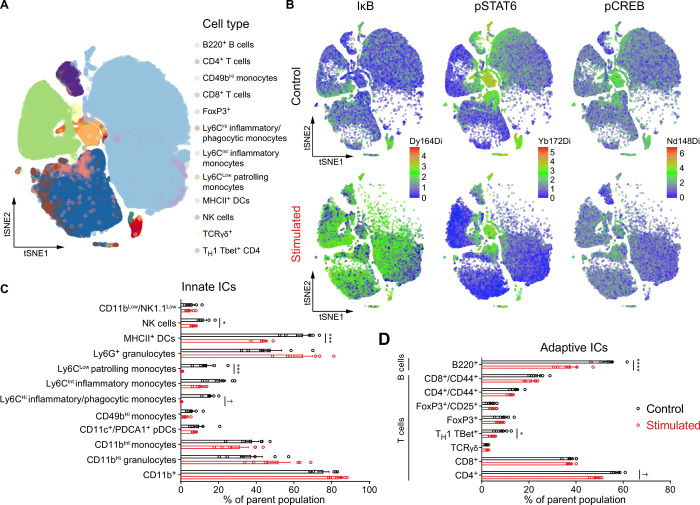
Fig. 6. CRHPVN activation drives changes in systemic immunity consistent with immunosuppression.
(A) Cell subpopulation distribution in the pooled dataset based on all samples. (B) Composite tSNE plots of intracellular protein expression from control and optogenetically stimulated mice for IκB (left), pSTAT6 (middle), and pCREB (right). (C) Distribution of circulating innate immune cells (ICs) at baseline (black bars) and in response to CRH neuronal stimulation (red bars), including NK1.1+ NK cells, MHCII+ dendritic cells, Ly6CLow patrolling monocytes, and Ly6CHi inflammatory/phagocytic monocytes. (D) Distribution of circulating adaptive ICs at baseline (black bars) and in response to CRH neuronal stimulation (red bars), including B lymphocytes (B220+), was decreased. T lymphocyte subsets altered include TH1 TBet+ cells and CD4+ T cells. n = 6 mice per group, error bars represent SEM, Holm-Šidák test, *P < 0.05, ***P < 0.005, ****P < 0.001, †P < 0.0005.

