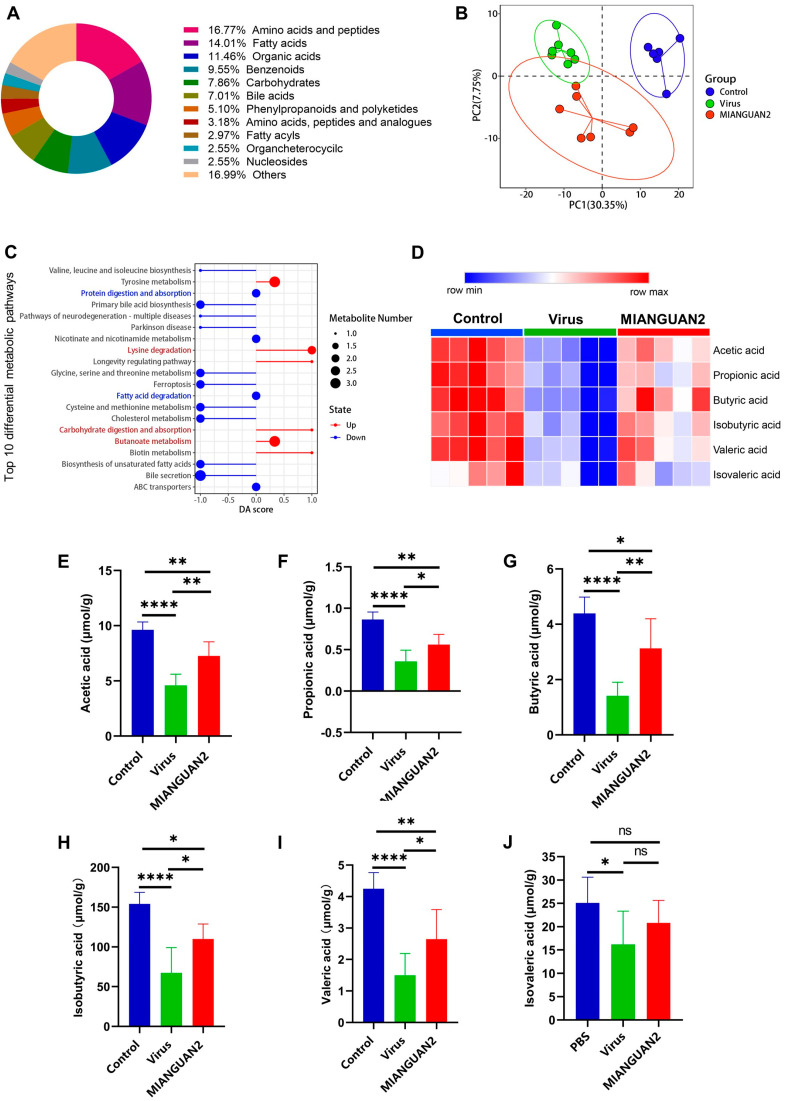
Figure 5.
Oral administration of Pediococcus pentosaceus MIANGUAN2 increases SCFA levels in the cecal content of influenza-infected mice. (A) The metabolite classification ring diagram displays the top 10 most abundant metabolites according to the classification of the final class. (B) The partial least squares-discriminant analysis (PLS-DA) plot among the three groups. (C) The bubble plot of differential abundance score (DA score) between the MIANGUAN2 group and the virus group. (D) The clustering heatmap depicts the SCFAs profiles in mice cecal content among the three groups. (E–J) The comparison of SCFAs concentration in cecal content of the three groups, including (E) acetic acid, (F) propionic acid, (G) butyric acid, (H) isobutyric acid, (I) valeric acid, and (J) isovaleric acid. Data in (E–J) are means ± SD and were analyzed using one-way ANOVA with post hoc Tukey’s test based on the normality of data assessed by the Shapiro-Wilk normality test. * p < 0.05, ** p < 0.01, **** p < 0.0001, and ns, not significant.

