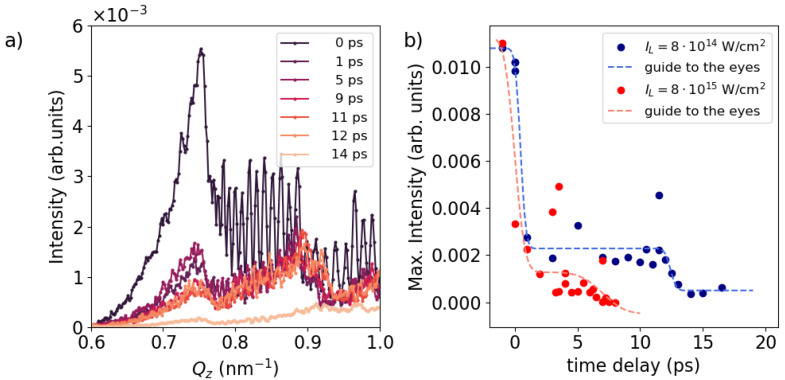
Figure 3.
In-plane signal along around the dynamical diffraction area between and . (a) In-plane signal for different time delays at lower laser intensity case (). (b) The circular dots display the integrated signal between = 0.65–0.79 nm−1 as a function of time delay. The dashed line represents a guide to the eyes. Blue color stands for the lower laser intensity of and red denote the higher laser intensity .

