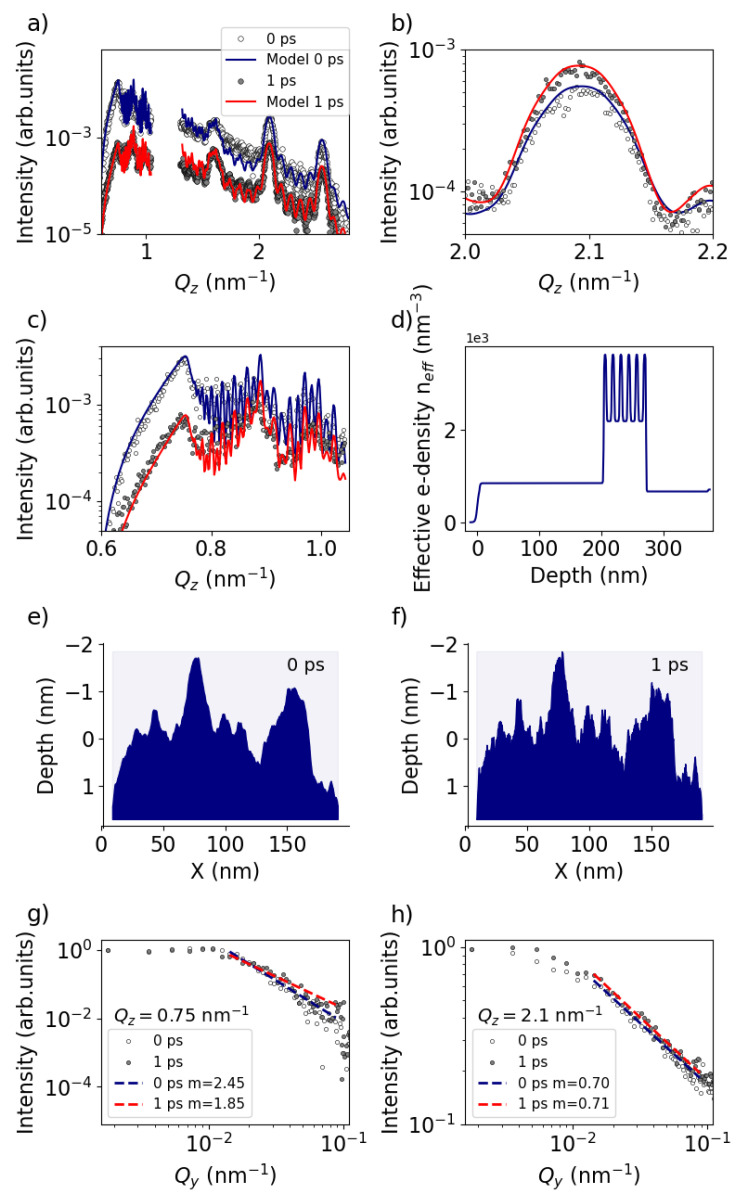
Figure 4.
GISAXS signals and corresponding retrieved real-space electron density profile. (a) Lineout at (white circular dots) and (grey circular dots) after the laser intensity peak. Solid lines represent models using the program BornAgain (https://bornagainproject.org/). (b) Zoom into the area of the Bragg-like peak at and (c) zoom into the area of dynamical diffraction around . (d) Retrieved real-space effective electron density profile as a function of the depth (Z). The laser irradiates the sample from the left. (e) Generated surface model for , and (f) , . (g) Lineout along at the Al Yoneda peak (). Dashed lines indicate a fit of the decay. (h) Lineout along at .

