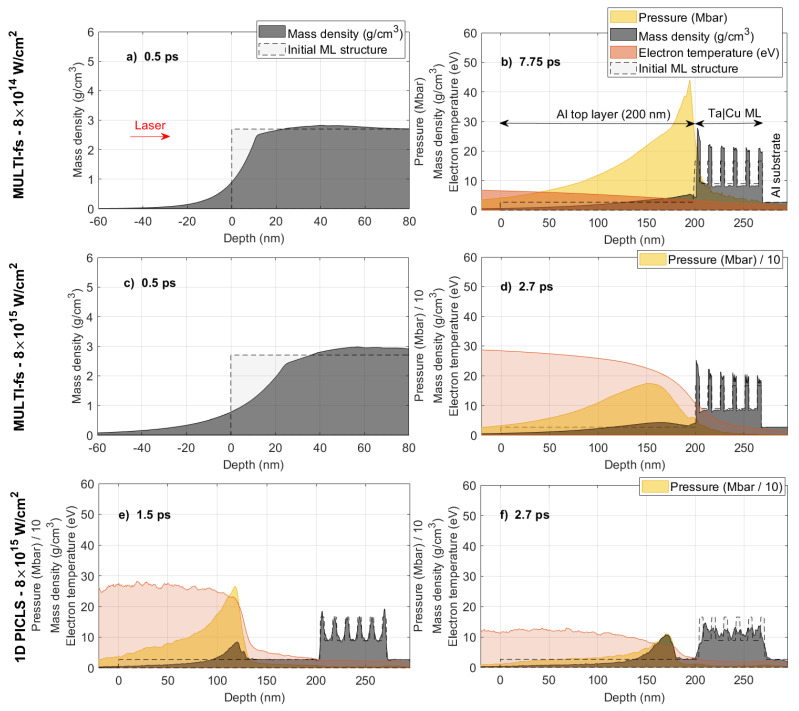
Figure 5.
MULTI-fs hydrodynamic simulations irradiated by a p-polarized laser pulse with a duration of 50 fs, a wavelength of 800 nm, and a laser intensity of (a,b) and (c,d) , respectively. Time delays are (a,c) 0.5 ps, (b) 7.75 ps and (d) 2.7 ps, respectively. The ML structure is the same as the experiment. (e,f) 1D Particle-in-cell PICLS simulation results at time delays of (e) 1.5 and (f) 2.7 ps, respectively. In all figures, the yellow, grey, and red regions represent the laser-induced pressure wave (in Mbar or Mbar), mass density (in ), and electron temperature (in eV), respectively. The dashed line denotes the initial sample density. The red arrow in (a) indicates the direction of the incoming laser.

