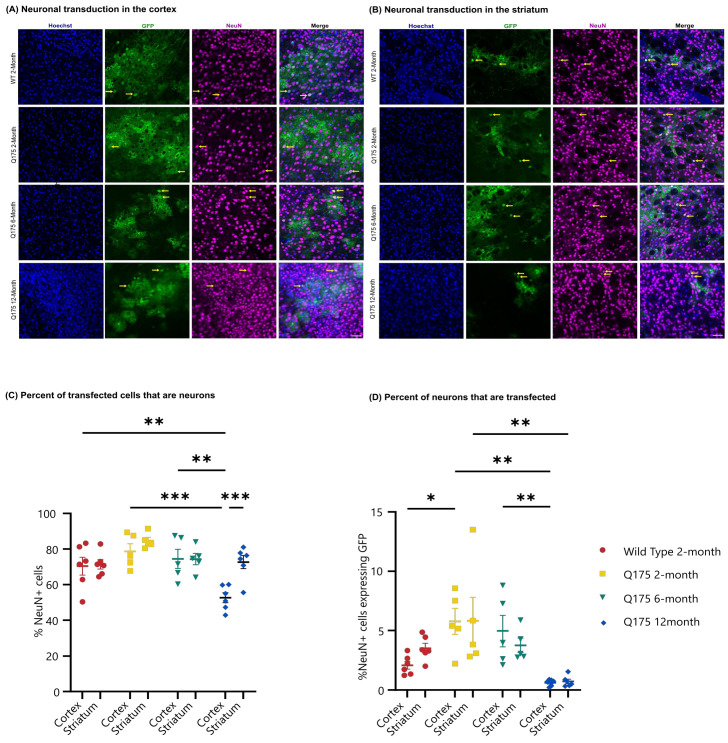
Figure 7.
GFP expression in neurons in the FUS-treated hemisphere following AAV administration. Confocal microscopic analysis of Hoechst (blue), GFP (green), and NeuN (magenta) expression in (A) the cortex and (B) striatum of the FUS-treated hemisphere of WT 2-month, zQ175 2-month, zQ175 6-month and zQ175 12-month-old mice injected intravenously with ss-AAV9-U6-miR10150-CBA-GFP at 5.5 × 10¹¹ vg/mouse. Yellow arrows highlight examples of colocalization of GFP (green) with the neuronal marker NeuN (magenta). Scale bar represents 50 µm. (C) Percentage of GFP+ cells that are neurons in the striatum and cortex. (D) Percentage of Hoechst cells that are GFP+ and NeuN+ in the striatum and cortex. WT 2-month (n = 6), zQ175 2-month (n = 5), zQ175 6-month (n = 5), and zQ175 12-month (n = 6). Data were analyzed using a two-way ANOVA followed by Tukey’s multiple comparisons test. * p < 0.05, ** p < 0.01, *** p < 0.001. Data shown are mean ± SEM.

