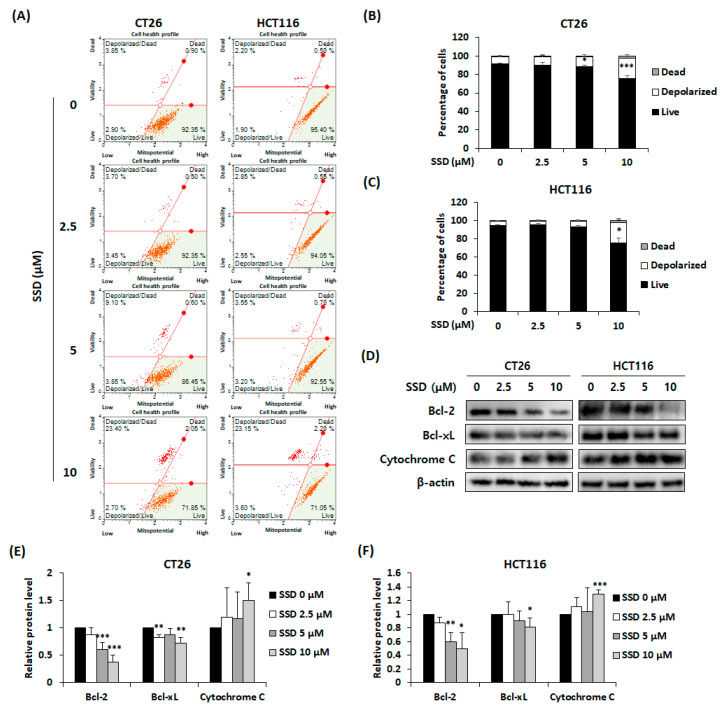
Figure 4.
Effect of SSD on mitochondrial depolarization of CRC cells. (A) Mitochondrial assay of CT26 and HCT116 cells after SSD treatment for 24 h. (B,C) Percentage of depolarized cells in SSD-treated CT26 (B) and HCT116 (C) cells. (D) CT26 and HCT116 cells were treated with SSD for 24 h. The protein expression of mitochondria-associated apoptosis factors was detected using Western blot analysis. (E,F) Image J software (1.52a) was used to measure relative protein levels. The results are presented as mean ± standard deviation of three repeated experiments, and the representative images are included. * p < 0.05, ** p < 0.01 and *** p < 0.001.

