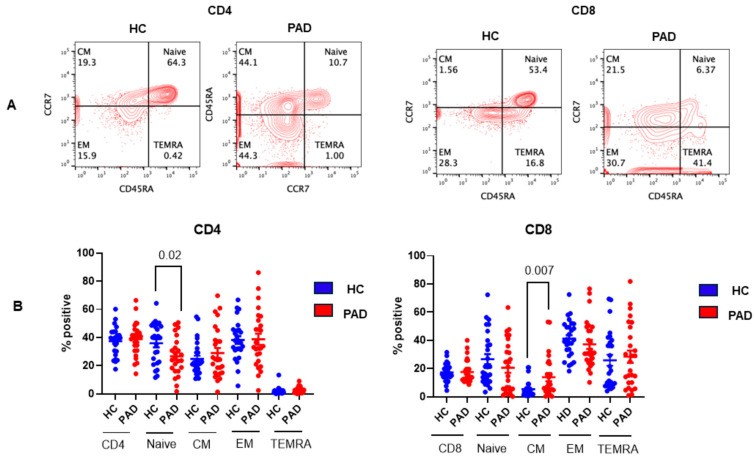
Figure 5.
Subsets of CD4+ and CD8+ T cells in the HC and PAD patients following two doses of SARS-CoV-2 vaccine. A representative contour flow cytograph is shown (A). Cumulative data show significantly decreased naïve CD4+ T cells and significantly decreased CD8TCM cells in PAD patients as compared to the HC (B).

