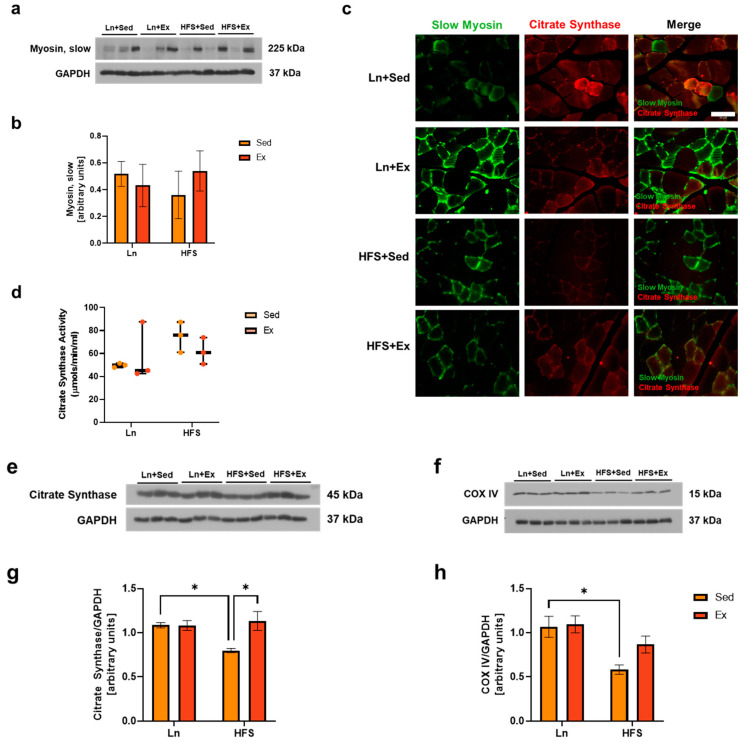
Figure 2.
Exercise rescues mitochondrial loss from the GAS muscle of obese animals. (a) Representative immunoblots of slow myosin. (b) Densitometry analysis of slow myosin levels. (c) Co-immunofluorescence staining for slow myosin and citrate synthase on GAS muscle sections, 20×; scale bar 50 μm. (d) Mean (± SEM) level of citrate synthase enzyme activity in GAS muscle. (e,f) Representative immunoblots of citrate synthase and COX IV, respectively. (g) Densitometry analysis of citrate synthase; * p < 0.05, Ln + Sed vs. HFS + Sed and HFS + Sed vs. HFS + Ex. (h) Densitometry analysis of COX IV; * p < 0.05, Ln + Sed vs. HFS + Sed. Data shown as means ± SEM, n = 3 per group.

