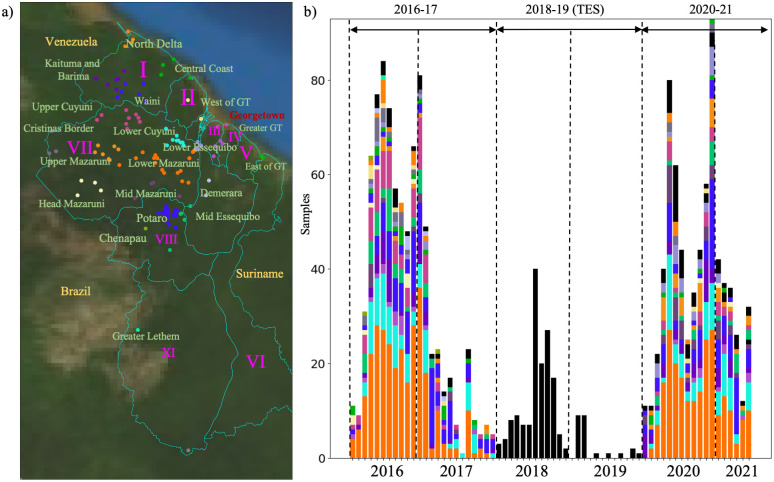
Fig 1. Spatial and temporal distribution of Plasmodium falciparum samples in Guyana.
a) Epidemiological zones (n = 20) delimited using an informed approach following access using roads and rivers. Administrative Regions are indicated in purple. b) temporal distribution of samples (n = 1,409 monoclonal infections) colored by patient travel history. Three sampling periods could be observed 2016–2017 (n = 773), 2018/2019 where samples were collected as part of a therapeutic efficacy study (TES) (n = 174) with no information on patient travel history, and 2020–2021 (n = 531). Samples with no travel history information are represented in black. Map was created using Basemap v1.4.1. plotted using Guyana—Subnational Administrative Boundaries acquired from [75].

