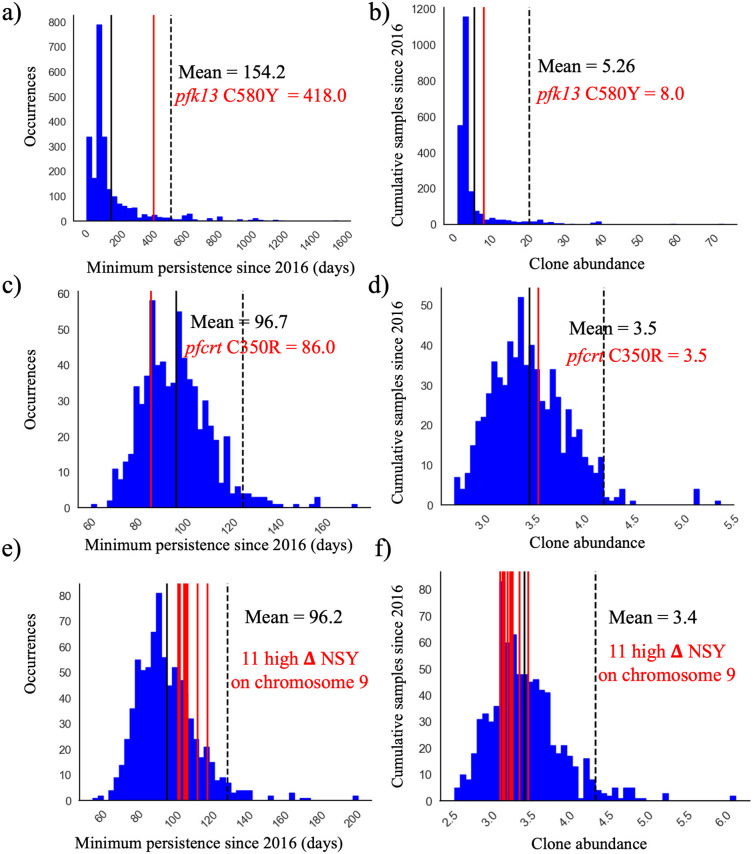
Fig 4.
Clone persistence and clonal abundance for nonsynonymous (NSY) mutation with similar (± 0.05) MAF (a-b) pfk13 C580Y (minor allele frequency (MAF) = 0.007 ± 0.05 n = 2,360), c-d) pfcrt C350R (MAF = 0.46 ± 0.05 n = 683) and (e-f) Eleven NSY (nine genes) on chromosome 9 which increased in frequency (in 99th percentile: ΔFREQUENCY ≥ 28.4%—MAF = 0.29 ± 0.05 n = 853). Vertical black lines represent the mean of the distribution, red vertical lines are the mutations observed, and the dashed line is 95th percentile at the particular MAF.

