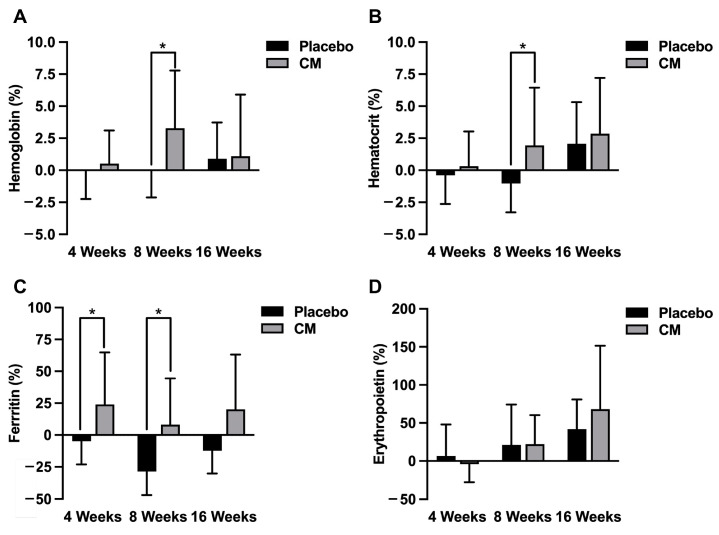
Figure 3.
Change rates in the levels of hemoglobin, hematocrit, ferritin and erythropoietin in the placebo and CM groups during the study period. The change rates were calculated by comparing the values at 4 weeks, 8 weeks and 16 weeks after the test food intake with those at registration (0 week) in hemoglobin (A), hematocrit (B), ferritin (C) and erythropoietin (D), and expressed as a percentage. Data are shown as the mean ± SD, and compared between the placebo (n = 11) and CM (n = 11) groups. * p < 0.05.

