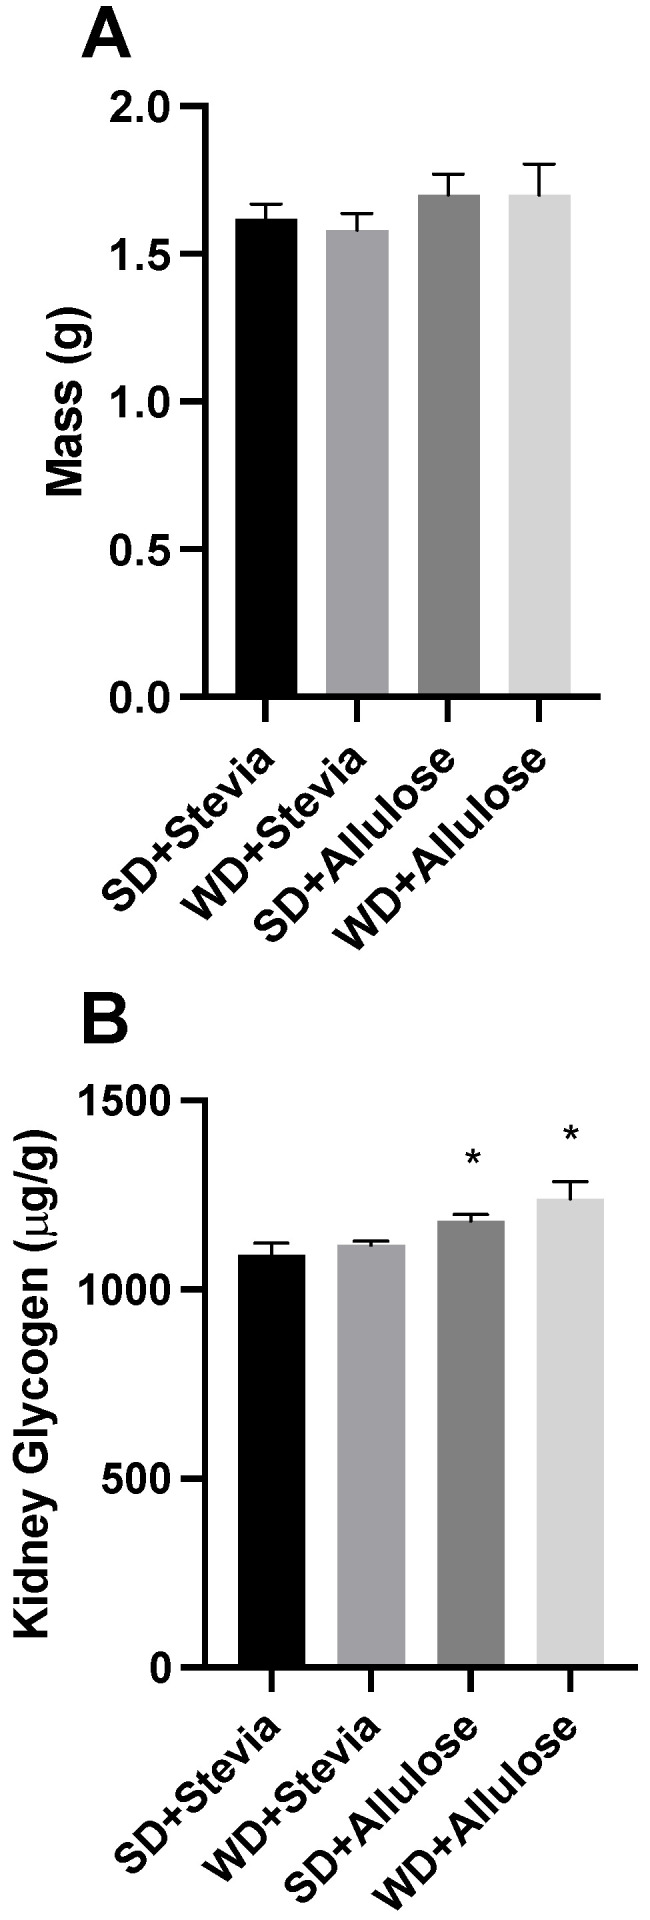
Figure 5.

Kidney analysis following 12 wks of allulose consumption. Kidney mass was measured (A) prior to analysis of glycogen (B) following 12 wks of a Western diet (WD) and standard diet (SD) with stevia or allulose in the drinking water. N = 10. * p < 0.05 vs. SD+stevia.
