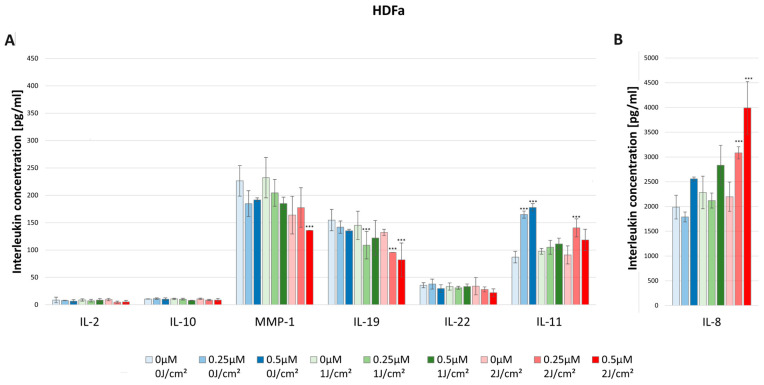
Figure 8.
(A) The concentration of IL-2, IL-10, MMP-1, IL-19, IL-22, and IL-11 in the supernatants from cell culture HDFa line in different light doses (0 J/cm2, 1 J/cm2, 2 J/cm2) and HY concentrations (0 μM, 0.25 μM, 0.5 μM). Statistical differences were marked concerning the dark control group within a given cytokine. The values represent the means ± SD. *** p < 0.01. (B) The concentration of IL-8 in the supernatants from cell culture HDFa line in different light doses (0 J/cm2, 1 J/cm2, 2 J/cm2) and HY concentrations (0 μM, 0.25 μM, 0.5 μM). The values represent the means ± SD. *** p < 0.01.

