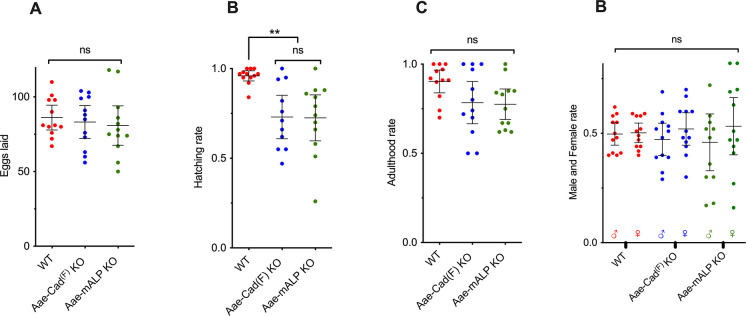
Fig 3. Development analysis of A. aegypti mutant populations.
Twelve females were isolated after blood feeding and monitored for eggs laid (A), hatching (B), development to adulthood (C) and differentiation to males (♂) and females (♀) (D). Error bars are medians with 95% confidence intervals. One-way ANOVA analysis was performed to obtain the P values. Values of P > 0.05 were considered not statistically significant (ns) and P ≤ 0.01 are statistically significant (**).

