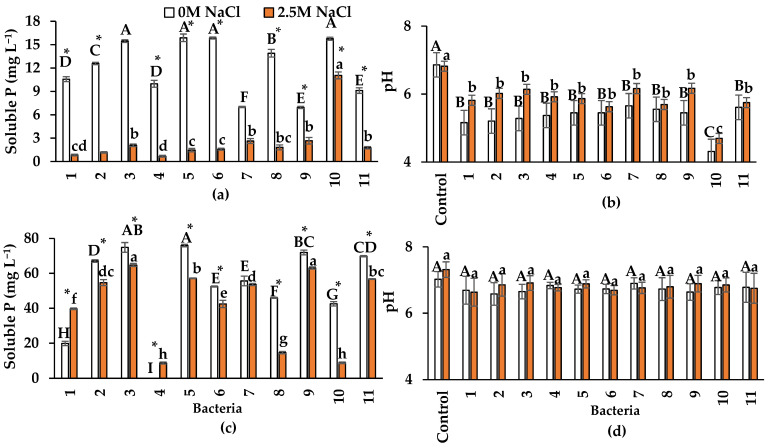
Figure 3.
Soluble P concentration and pH variation in the free-bacteria extract after solubilization test (48 h) by halophilic endophytic bacteria in two NaCl concentrations: (a,b) when using Ca3(PO4)2; or (c,d) phytic acid. Values correspond to average ± standard deviation, n = 3. Different capital letters show differences in the soluble P concentration and pH when comparing endophytic bacteria in 0 M NaCl. Different lowercase letters show differences when comparing endophytic bacteria in 2.5 M NaCl. Asterisk (*) shows a significant difference when comparing the same bacteria in 0 or 2.5 M NaCl. In all cases, one-way ANOVA and Tukey’s post hoc test (α = 0.05) were used.

