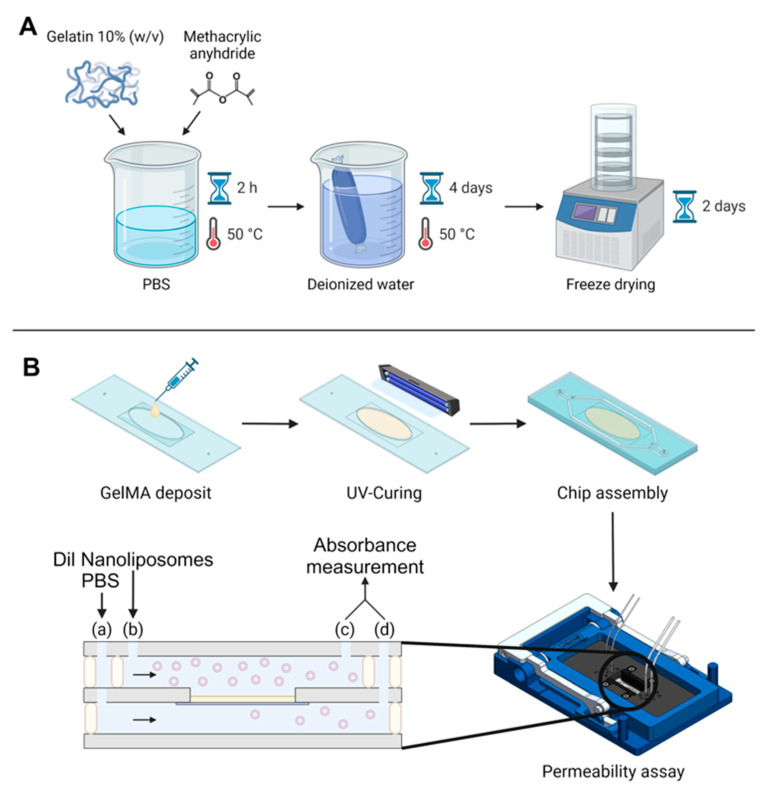
Figure 1.
Global experimental pattern. (A) Synthesis protocol for GelMA. (B) Protocol for GelMA integration in the chip, chip assembly, and permeability assay. The black arrows indicate flow direction, beige rectangle symbolizes the GelMA membrane. Two syringe pumps were used at two different flow rates; fluids were injected in the microfluidic chip with a flow rate ratio of 2: (a) 30 µL/min for Dil nanoliposomes in PBS and (b) 15 µL/min for PBS. Chip outputs (c) and (d) were collected from both the bottom and top channel every hour for absorbance measurement by UV–Vis spectroscopy.

