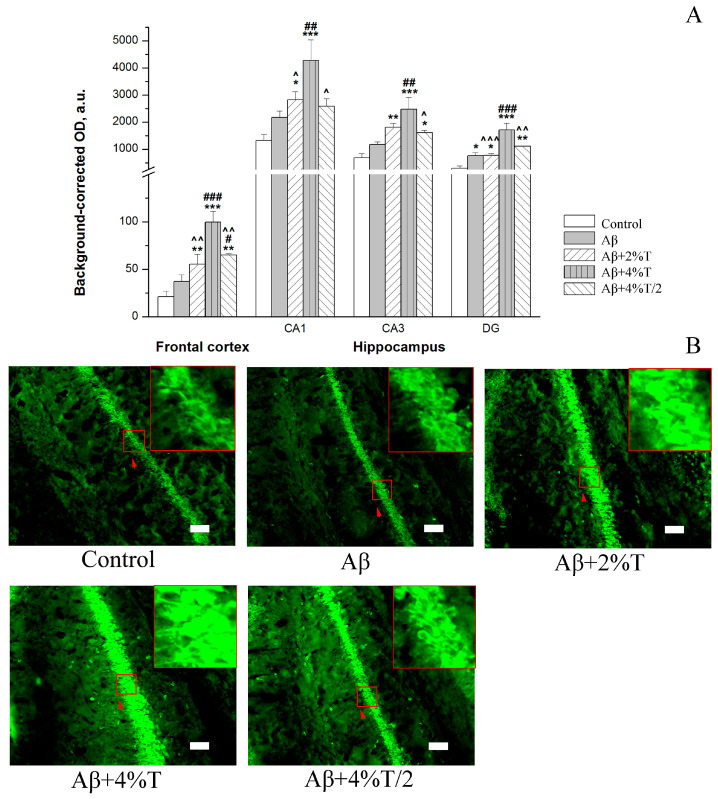
Figure 1.
The effect of treatment with trehalose (2% or 4% solution daily (“Aβ + 2% T” or “Aβ + 4% T”) or 4% solution every other day (“Aβ + 4% T/2”), 14 days) on autophagy activity, quantified as immunofluorescence of an autophagy marker (LC3-II) in the brain of mice with Aβ-induced AD-like pathology. To set up the AD model, mice were given bilateral i.c.v. injections of Aβ25–35. The control group received vehicle (sterile water) i.c.v. injections. The treatment with trehalose was started 2 days after the i.c.v. Aβ25–35 administration. (A) Quantitative results. The data are expressed as the mean ± SEM of the values obtained in an independent group of animals (n = 3 per group). Statistically significant differences: * p < 0.05, ** p < 0.01, *** p < 0.001 vs. control group; # p < 0.05, ## p < 0.01, ### p < 0.001 vs. Aβ group; ^ p < 0.05, ^^ p < 0.01, ^^^ p < 0.001 vs. “Aβ + 4% T” group. (B) LC3-II immunofluorescence in the CA1 hippocampal area. The fluorescence images were finally obtained by an Axioplan 2 microscope. Magnification: ×200; scale bar (white rectangle), 50 μm. High zoom images of areas indicated by red arrows within red squares with LC3-II-positive cells are shown in the insets.

