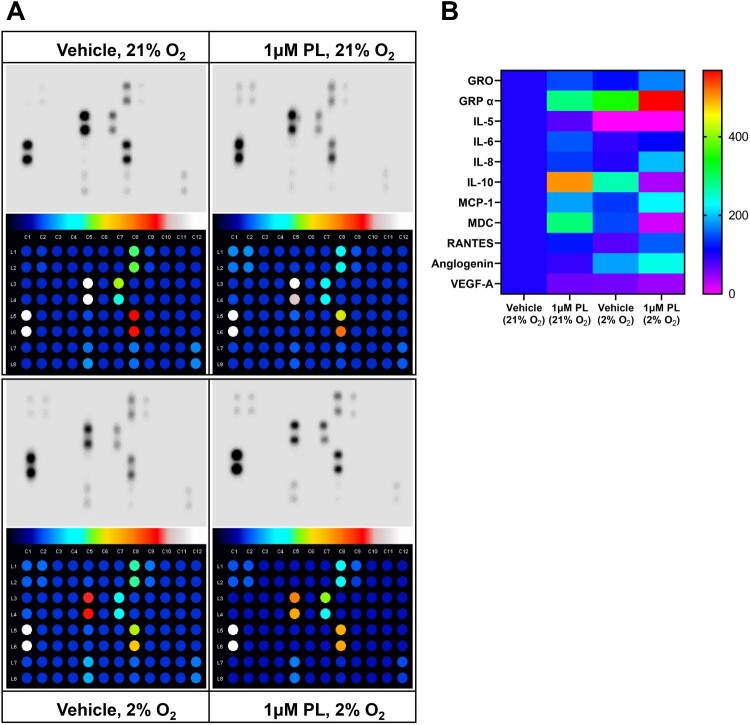
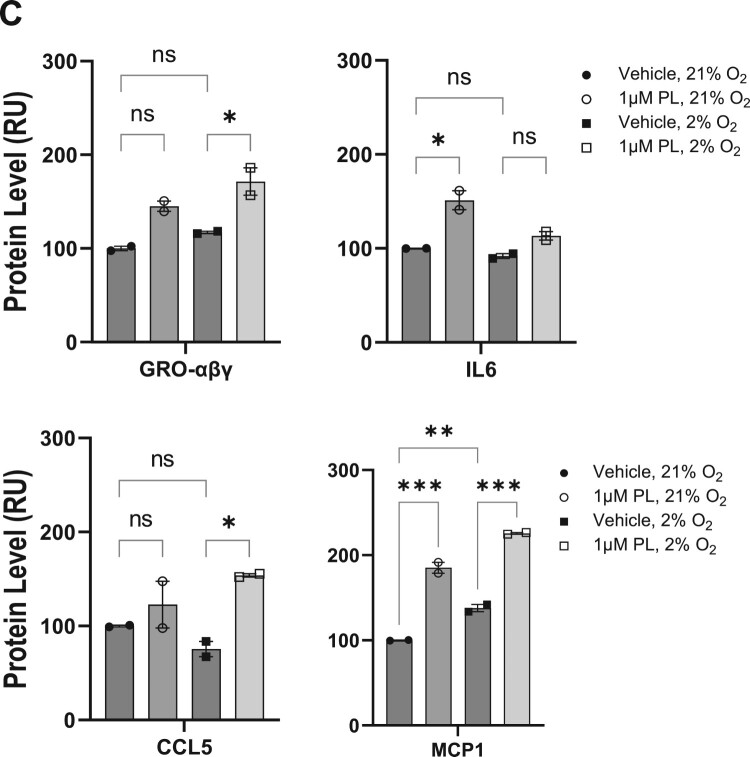
Figure 4.
Regulation of cytokines following treatment with piperlongumine. HaCaT cells were treated with 1 μM piperlongumine at the indicated oxygen concentration. After incubation for 48 h, the clear supernatant was analyzed to detect specific cytokines and chemokines using enzyme-linked immunosorbent assays. (A) Representative immunoblot images and quantified results from whole membranes. (B) Map of specific cytokines and chemokines corresponding to each spot. (C) Statistically significant levels of secreted proteins are depicted as a heatmap analysis. The arbitrary value of the protein quantitation was normalized to that of vehicle-treated supernatant in 21% oxygen. (D) The expression of selective secretory proteins was analyzed. Positive and negative blots supplied by the manufacturer were used as the internal normalization control. GraphPad Prism was used to prepare the graphs, and statistical significance was determined using one-way ANOVA. ns; non-significant, *; p < 0.05, **; p < 0.01, ***; p < 0.005


