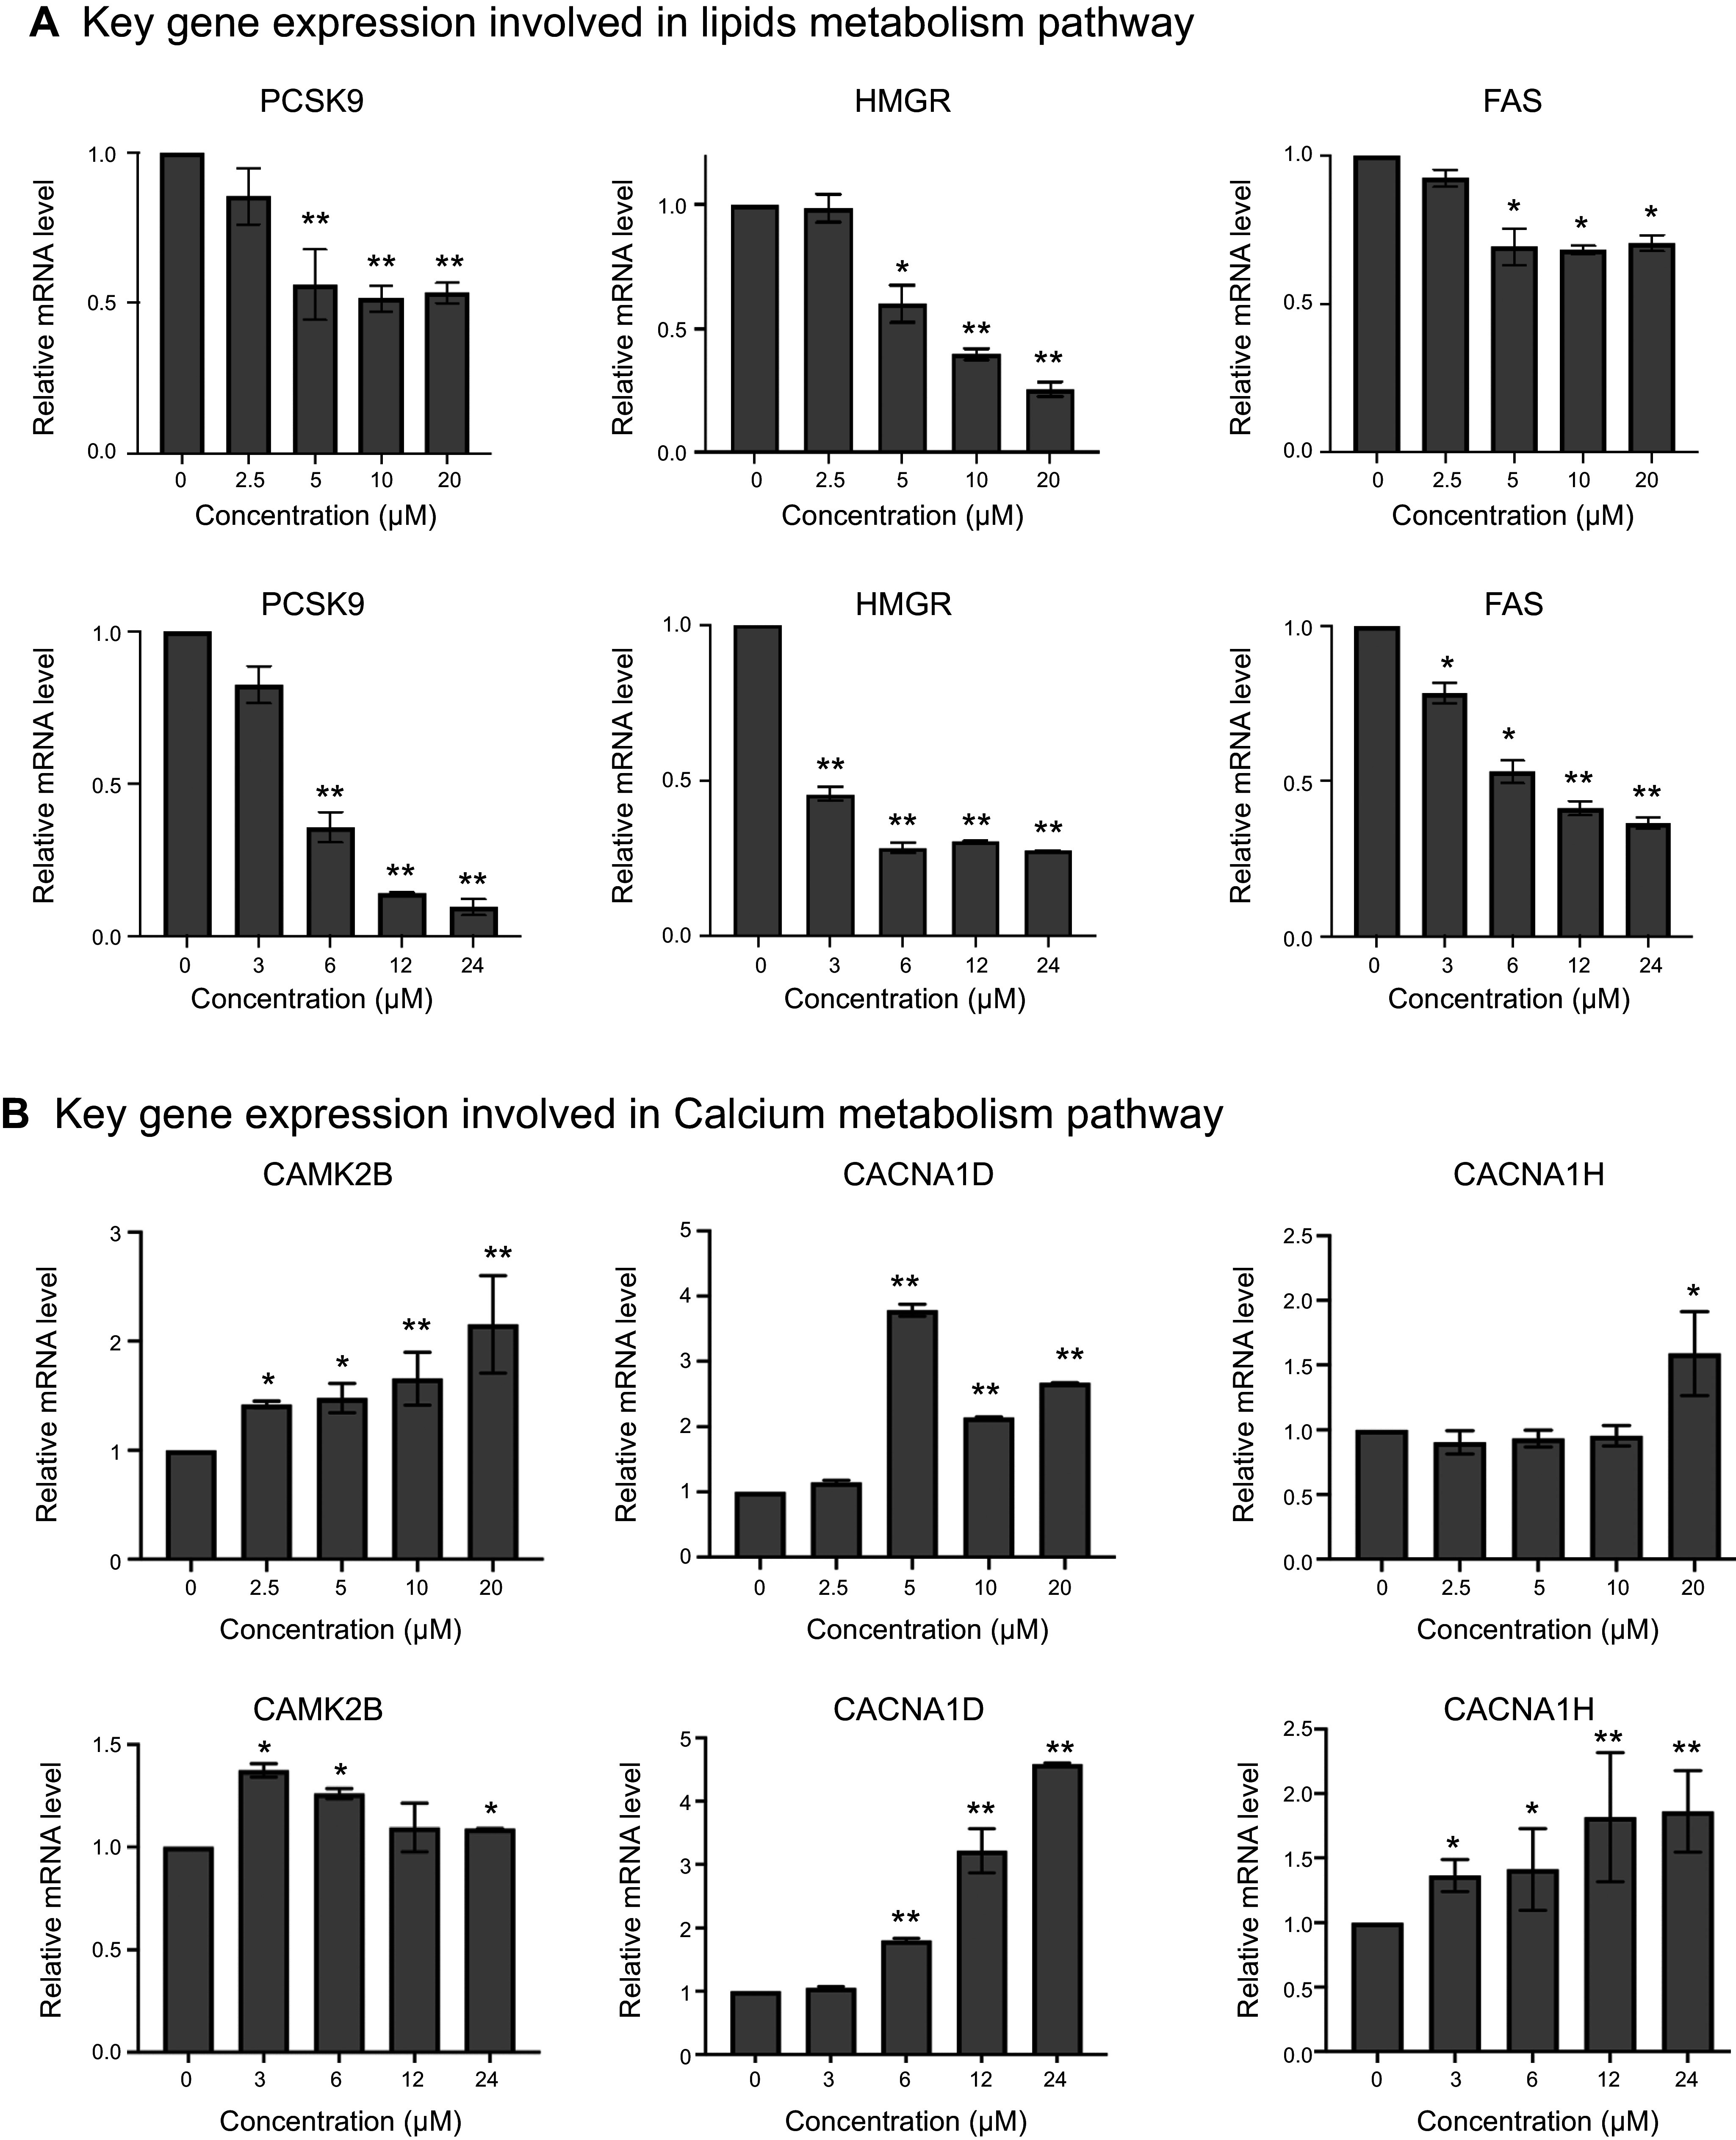
Figure 4.

Reverse transcription (RT)-quantitative (q)PCR analysis of gene expression involved in calcium signaling and lipids metabolism pathways. HepG-2 cells were cultured in high glucose (HG) medium for 72 h, followed by treating with 0, 2.5, 5, 10, and 20 µM cholestenoic acid (CA) treatment for 6 h, and 20 µM CA treatment for 0, 3, 6, 12, and 24 h. The expression of key genes involved in calcium signaling and lipids metabolism pathways were measured by RT-qPCR. A: dose- and time-dependent expression of key genes involved in lipid metabolism signaling pathway. B: dose- and time-dependent expression of key genes involved in calcium signaling pathway. Each bar represents the average data (means ± SD; n = 3). *P < 0.05, **P < 0.01.
