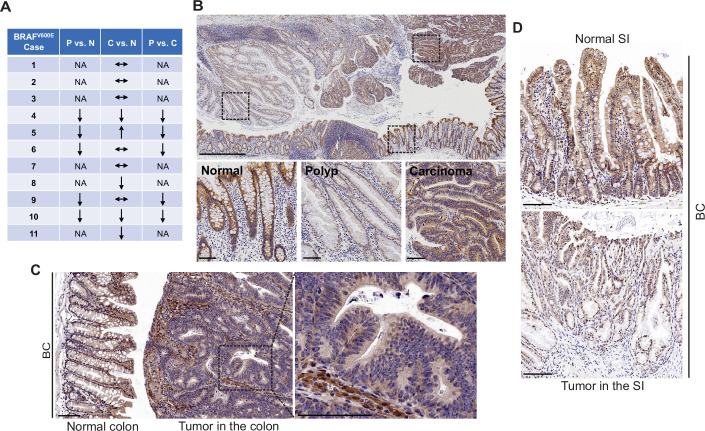
Figure 1. FAK downregulation in serrated tumors.
(A) Summary of FAK IHC staining in 11 human BRAFV600E-mutant CRC samples. N represents normal colon; P represents polyp; C represents carcinoma; NA, not applicable; ↔ represents no change; ↑ represents an increase. ↓ represents a decrease. (B) Representative IHC staining of BRAFV600E-mutant patient SSA/P, serrated colorectal adenoma, and adjacent normal tissues. (C) IHC staining of Fak in small intestine tumors in a 12-month-old BC mouse. (D) Representative IHC staining of Fak in colon tumor in 12-month-old BC mice. Scale bars in (B) 1 mm (upper panel) and 100 µm (lower panel). Scale bars in (C) and (D) 100 µm.

