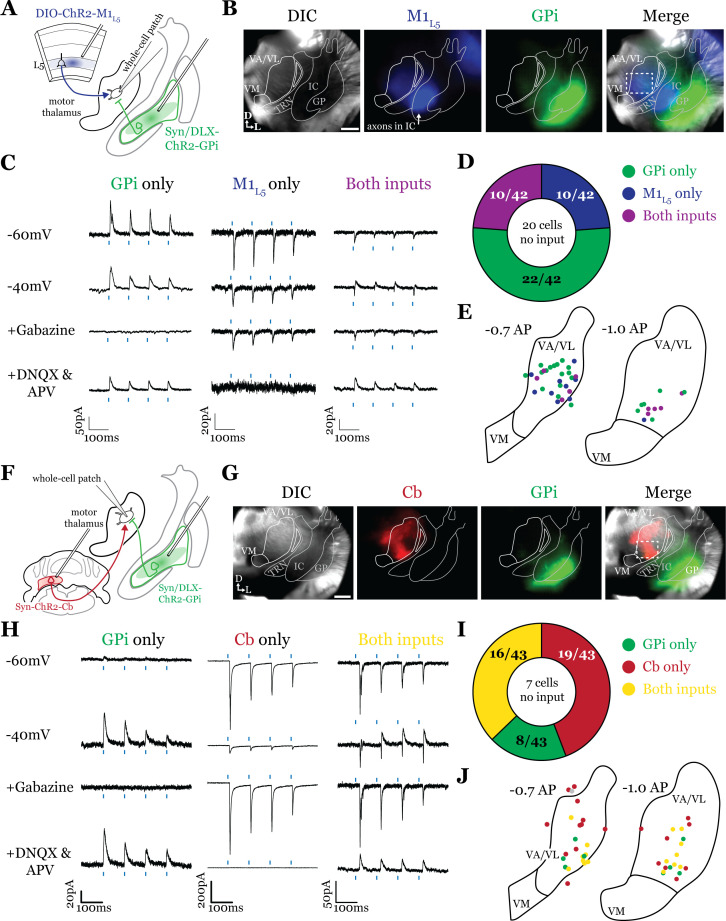
Figure 3. Internal segment of the globus pallidus (GPi) inputs to motor thalamus converge with those from layer 5 of primary motor cortex (M1L5) and cerebellar nuclei (Cb).
(A) Schematic of experiment. (B) Representative images from recording apparatus of the acute coronal slice (left) showing injection sites into GPi and terminals in motor thalamus (green), M1L5 axons coursing through the internal capsule and terminals in motor thalamus (blue), and merged image. Dashed rectangle indicates approximate target of recording. Arrows in bottom left of image represent dorsal (D) and lateral (L) directions. Scale = 0.5 mm. (C) Representative traces in voltage clamp of laser-evoked responses (blue rectangles) in three motor thalamic neurons (recorded with low Cl- internal solution) held near the resting membrane potential (Vm, –60), at –40 mV, at –40 mV with application of the GABAA antagonist gabazine (20 μM), and at –60 mV with application of the ionotropic glutamate receptor (iGluR) antagonists, DNQX (50 μM) and AP5 (100 μM). Note that some cells only exhibit inhibitory postsynaptic currents (IPSCs), some only excitatory postsynaptic currents (EPSCs), and some demonstrate a mixed EPSC/IPSC response, of which the excitatory or inhibitory components are abolished by iGluR or GABAA blockade, respectively. For quantification of the synaptic properties of excitatory inputs, see Figure 6D. (D) Summary data depicting how many recorded cells receive only GPi input, only M1L5 input, both, or neither. (E) Spatial pattern of motor thalamus neurons receiving each input type color coded to the inputs they receive. (F) Schematic of experiment. (G) Representative images from recording apparatus of the acute coronal slice (left) showing injection sites into GPi and terminals in motor thalamus (green), Cb terminals in motor thalamus (red), and merged image. Dashed rectangle indicates approximate target of recording. Arrows in bottom left of image represent dorsal (D) and lateral (L) directions. Scale = 0.5 mm. (H) Representative traces in voltage clamp of laser-evoked responses (blue rectangles) in three motor thalamic neurons (recorded with low Cl- internal solution) held near the resting membrane potential (Vm, –60), at –40 mV, at –40 mV with application of the GABAA antagonist gabazine (20 μM), and at –60 mV with application of the iGluR antagonists, DNQX (50 μM) and AP5 (100 μM). Note that some cells only exhibit IPSCs, some only EPSCs, and some demonstrate a mixed EPSC/IPSC response, of which the excitatory or inhibitory components are abolished by iGluR or GABAA blockade, respectively. (I) Summary data depicting how many recorded cells receive only GPi input, only Cb input, both, or neither. (J) Spatial pattern of motor thalamus relays color coded to the inputs they receive.

