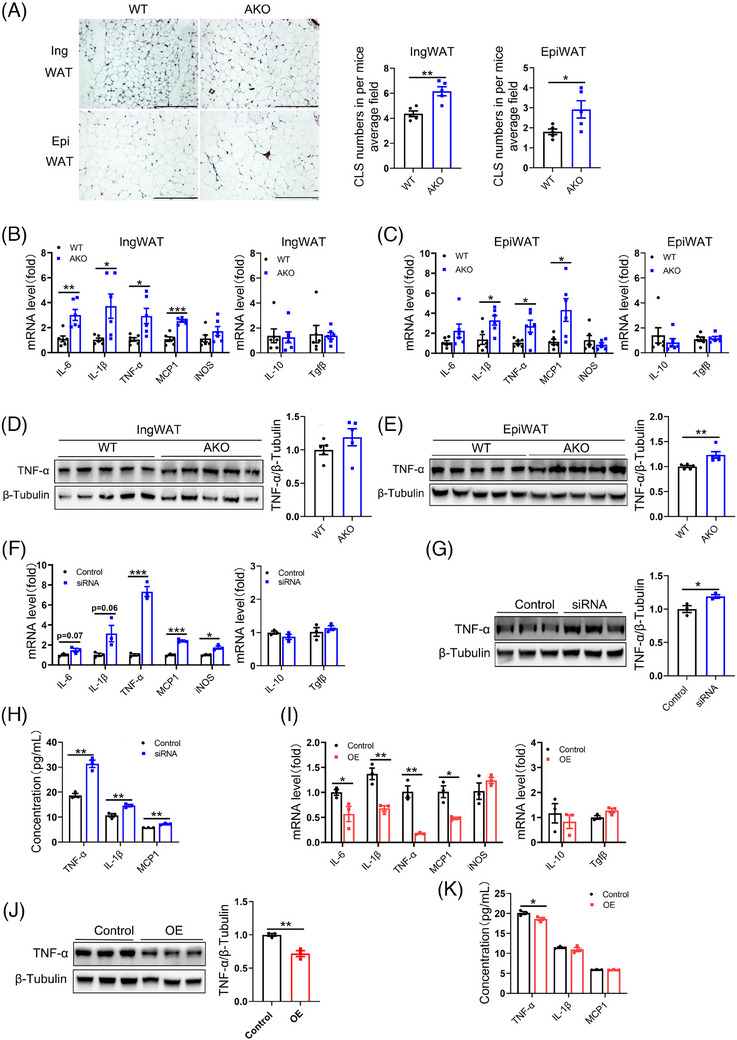
FIGURE 4.

Adipocyte‐specific FAK deletion exacerbates adipose tissue inflammation. (A) IHC staining analysis F4/80 in IngWAT and EpiWAT, as well as quantification of crown‐like structures (CLS) (n = 5 per group). Five different fields of view were counted for each slice and the mean was calculated. Scale bar, 100 µm. (B–C) qPCR analysis mRNA expression of IL‐6, IL‐1β, TNF‐α, MCP1, iNOS, IL‐10, Tgfβ in IngWAT and EpiWAT (n = 6 per group). (D–E) Western blot analysis protein expression of TNF‐α in IngWAT and EpiWAT (n = 5 per group). (F, I) qPCR analysis mRNA expression of IL‐6, IL‐1β, TNF‐α, MCP1, iNOS, IL‐10, Tgfβ in FAK siRNA or OE group (n = 3 per group). (G, J) Western blot analysis protein expression of TNF‐α in FAK siRNA or OE group (n = 3 per group). (H, K) ELISA analysis TNF‐α, IL‐1β, MCP1 concentration in the supernatant of FAK siRNA or OE group (n = 3 per group). IHC, immunohistochemistry; IngWAT, inguinal white adipose tissue; EpiWAT, epididymal white adipose tissue; IL‐6, Interleukin‐6; IL‐1β, interleukin‐1beta; TNF‐α, tumour necrosis factor α; iNOS, inducible nitric oxide synthase; MCP1, monocyte chemoattractant protein 1; IL‐10, Interleukin‐10; Tgfβ, transforming growth factor β; All values are expressed as MEAN ± SEM, *P < 0.05, **P < 0.01, ***P < 0.001.
