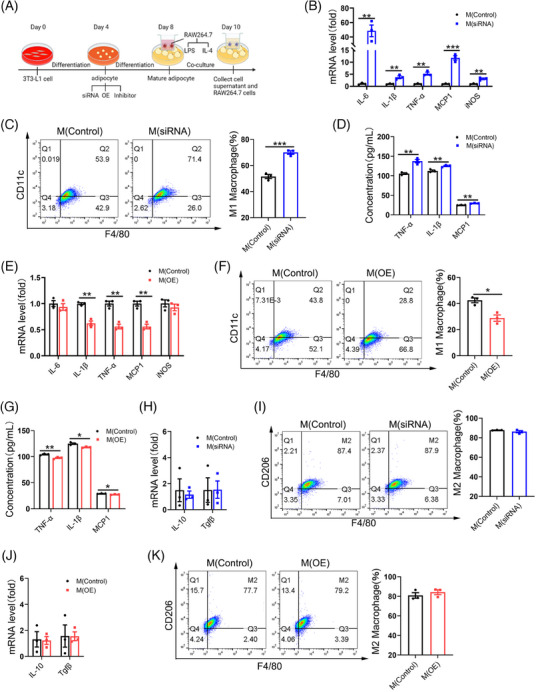
FIGURE 6.

Adipocyte‐specific FAK deletion activate M1 macrophages. (A) Experimental flow chart for co‐culture of macrophages and adipocytes. Macrophages were co‐cultured with adipocytes (transfected FAK siRNA) (B–D) or (transfected FAK OE vector) (E–G) and the addition of LPS stimulation for 48 h. (B, E) qPCR analysis RAW264.7 cells mRNA expression of IL‐6, IL‐1β, TNF‐α, MCP1, iNOS in FAK siRNA or FAK OE group (n = 3 per group). (C, F) Flow cytometry analysis demonstrated the number of M1 macrophages in FAK siRNA or FAK OE group (n = 3 per group). (D, G) ELISA analysis TNF‐α, IL‐1β, MCP1 concentration in the supernatant of FAK siRNA or FAK OE group (n = 3 per group). Macrophages were co‐cultured with adipocytes (transfected FAK siRNA) (H–I) or (transfected FAK OE vector) (J–K) and the addition of IL‐4 stimulation for 48 h (H–I). (H, J) qPCR analysis RAW264.7 cells mRNA expression of IL‐10, Tgfβ in FAK siRNA or FAK OE group (n = 3 per group). (I, K) Flow cytometry analysis demonstrated the number of M2 macrophages in FAK siRNA or FAK OE group (n = 3 per group). LPS, lipopolysaccharide; IL‐4, interleukin 4. All values are expressed as MEAN ± SEM, *P < 0.05, **P < 0.01, ***P < 0.001.
