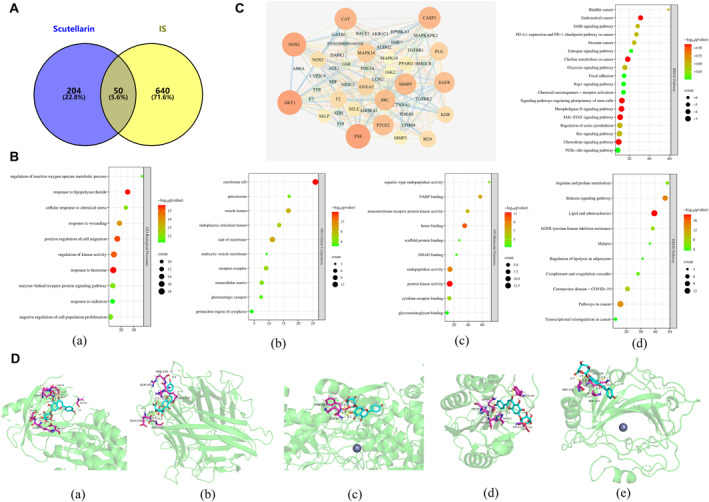
FIGURE 1.

Network pharmacology and molecular docking. (A) Venn diagram of the intersection targets. (B) GO function and KEGG pathway enrichment analysis; (a) biological processes; (b) cellular components; (c) molecular functions; (d) KEGG. (C) PPI network and KEGG pathway analyses. (D) Visualization of molecular docking between scutellarin and core targets; (a) Scutellarin and AKT1, (b) Scutellarin and TNF; (c) Scutellarin and NOS3; (d) Scutellarin and CASP3; (e) Scutellarin and CAT. GO, gene ontology; KEGG, kyoto encyclopedia of genes and genomes.
