
FIGURE 3.
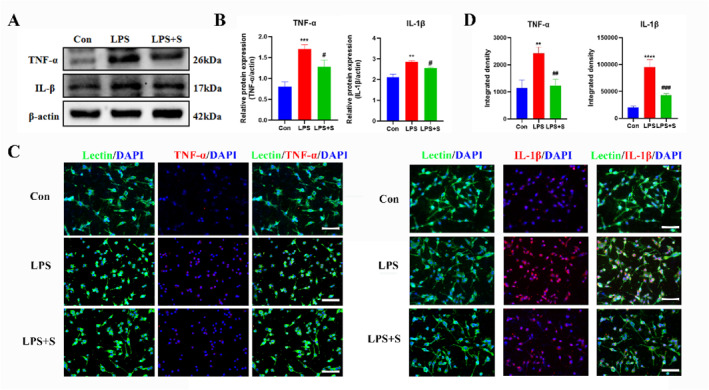
Effect of scutellarin on protein expression and fluorescence intensity of inflammatory factors in LPS‐stimulated BV‐2 microglial cells. (A, B) Western blotting bands and quantitative statistical plots. (C, D) Immunofluorescence images and quantitative statistics. The target factor (red), lectin (green), is a marker for microglia, and DAPI (blue) shows the nuclei. **p < 0.01, ***p < 0.001, ****p < 0.001 between control and LPS groups; #p < 0.05, ##p < 0.01, ###p < 0.001 between LPS and LPS + S groups. Scale bar = 50 μm. Values represent the mean ± SD of triplicate experiments.