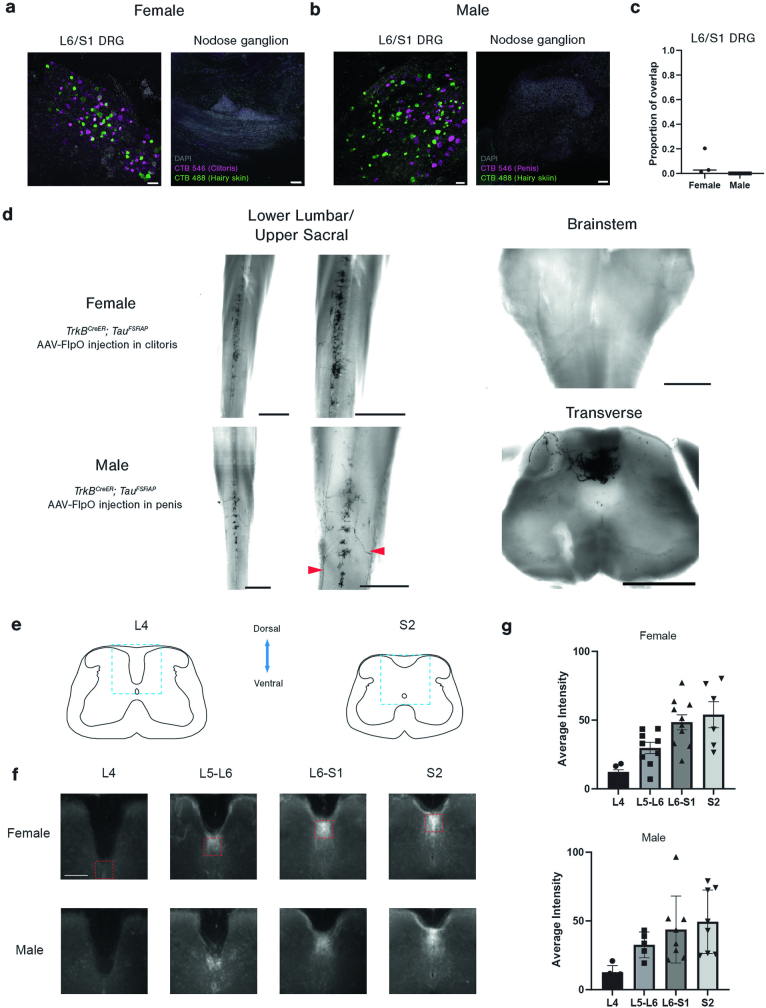
Extended Data Fig. 5. The central terminals of Krause corpuscle afferents.
a-b, Representative images of whole-mount L6 or S1 DRGs or nodose ganglion after injection of CTB tracers conjugated to different fluorophores into genital tissues (CTB-546) and adjacent mid-line hairy skin (CTB-488). Scale bar is 50 µm. c, Quantification of overlapping labelling of neurons identified by injection into genitalia and hairy skin, as in a and b. d, Whole-mount AP staining of the spinal cord of TrkBCreER; TauFSFiAP animals with AAV2-retro-hSyn-FlpO injected into the clitoris (upper panels) or penis (lower panels). The middle panels show magnified images of those shown on the left. Red arrowheads point to the individual axons entering the spinal cord. The images on the right show whole mount AP staining of the female dorsal column nucleus (top) and a transverse section of the male S1 spinal cord (bottom). Scale bar in d is 1 mm for whole mount images and 500 µm for transverse sections of AP staining. e, Schematics of spinal cord sections in L4 and S2 regions, with the dashed lines indicating the region subjected to image averaging in e. The diagram was created by G. Park. f, Averaged images of spinal cord terminals of Krause corpuscle afferents, labelled by injection of AAV2-retro-hSyn-FlpO into the genitalia of TrkBCreER; R26FSF-LSL-Tdtomato or RetCreER; R26FSF-LSL-Tdtomato. All images are of the same size and share the common scale bar (200 μm). The red squares refer to the region selected for fluorescence intensity quantification in g. g, Quantifications of fluorescence intensity in the square region (150×150 μm) immediately ventral to the dorsal column. The number of images analysed for females is 5, 9, 10, 6, for L4, L5-L6, L6-S1, S2, respectively. For males, the corresponding numbers were 5, 5, 8, and 8. Images for both females and males were obtained from more than 3 animals per sex. Error bars, s.d.

