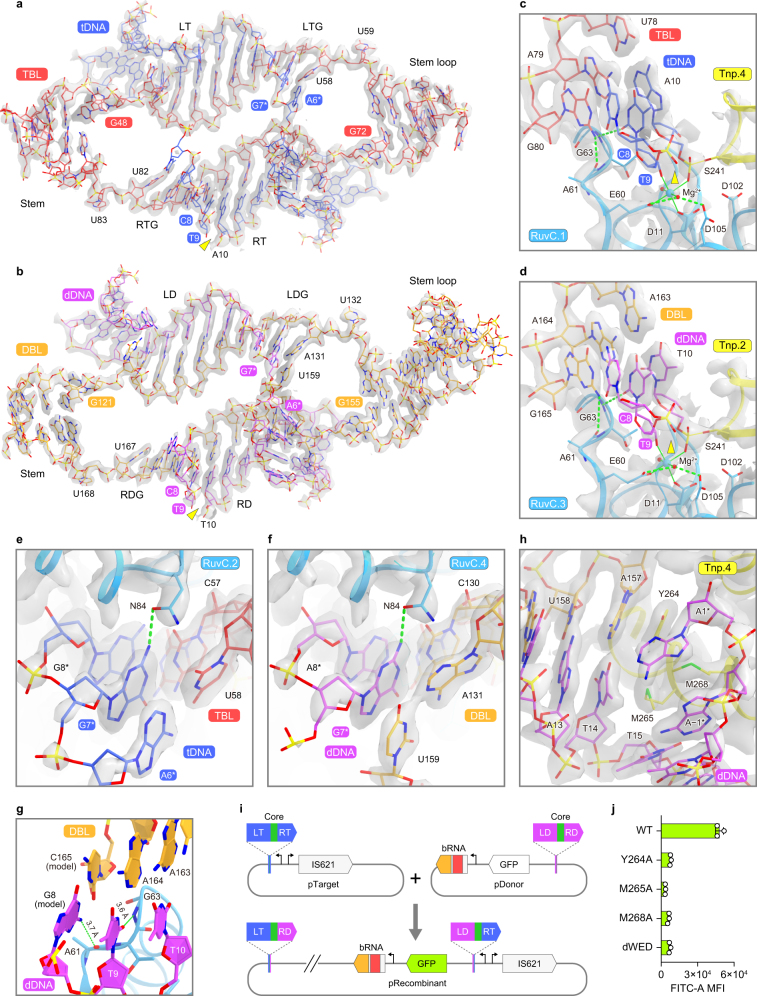
Extended Data Fig. 5. DNA recognition mechanism.
(a, b) Structures of TBL–tDNA (a) and DBL–dDNA (b). (c, d) Recognition of the CT core sequences in tDNA (c) and dDNA (d). (e, f) Recognition of the CT core-complementary sequences in tDNA (e) and dDNA (f). (g) Modeling of dG8 into the dDNA as part of the core dinucleotide. (h) Interaction between the DNA and the hydrophobic wedge. Similar interactions are observed in the four protomers. In (a–f) and (h), cryo-EM density maps are shown as grey semi-transparent surfaces. (i) Schematic of the bacterial recombination assays. Successful recombination between pTarget and pDonor places the gene encoding green fluorescent protein (GFP) downstream of the synthetic promoter, resulting in fluorescence. IS621, the IS621 recombinase. (j) DNA recombination activities of the WT IS621 and the hydrophobic-wedge mutants in the bacterial recombination assays. Data are shown as mean ± SD for three biological replicates. dWED, Y264A/M265A/M268A.

