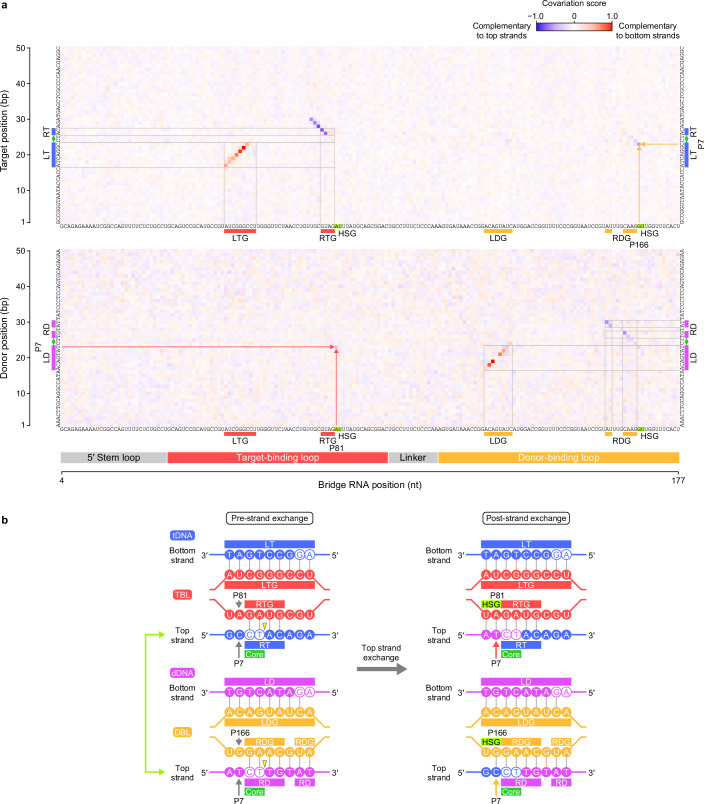
Extended Data Fig. 7. Covariation analysis.
(a) Nucleotide covariation and base-pairing potential between bRNAs and their target (top) and donor (bottom) sequences, calculated from 5,511 bRNA–target pairs and 2,201 bRNA–donor pairs, as described previously2. The IS621 bRNA sequence is shown across the x-axis. Covariation scores calculated from thousands of IS110 orthologues are colored according to strand complementarity, with −1 (blue) representing high covariation and a bias toward top strand base-pairing, 1 (red) representing high covariation and a bias toward bottom strand base-pairing, and 0 indicating no detectable covariation. Regions with substantial covariation signals indicating base-pairing for IS621 are boxed. These data indicated base-pairing potential between TBL-HSG P81 and dDNA P7 (red arrow) and DBL-HSG P166 and tDNA P7 (orange arrow) in IS621, suggesting the functional importance of the base-pairing at these positions across the IS110 orthologues. HSG, handshake guide. (b) Schematic of the predicted TBL–tDNA and DBL–dDNA base-pairing patterns before and after the strand exchange.

