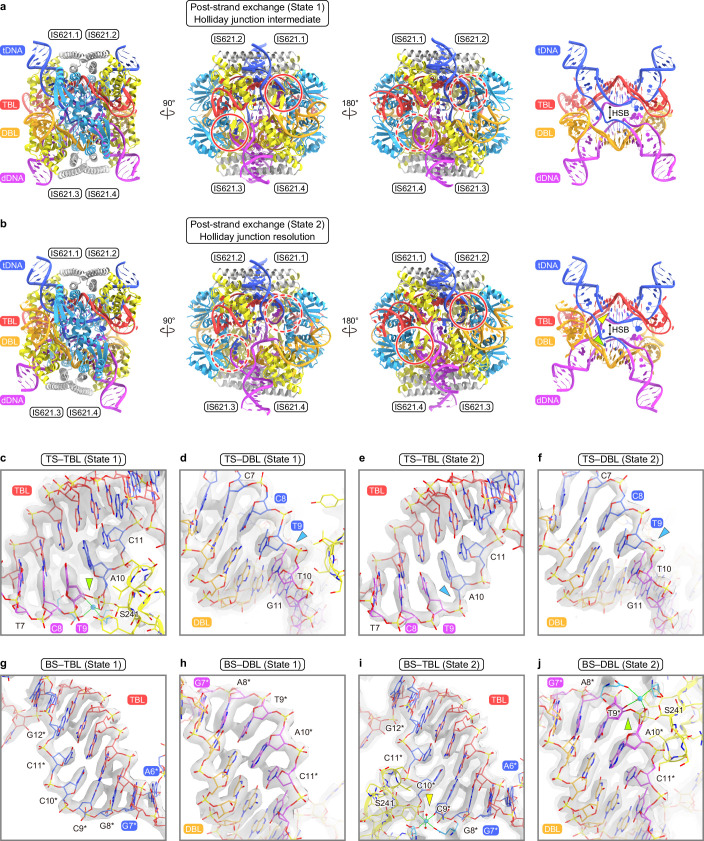
Extended Data Fig. 9. Structures of the IS621 synaptic complexes in the post-strand exchange states.
(a, b) Structures of the IS621 synaptic complexes in the post-strand exchange states (state 1) (a) and (state 2) (b). The active sites with the ordered and disordered S241 residues are indicated by red solid and dashed circles, respectively. (c–j) Close-up views of TS–TBL (state 1) (c), TS–DBL (state 1) (d), TS–TBL (state 2) (e), TS–DBL (state 2) (f), BS–TBL (state 1) (g), BS–DBL (state 1) (h), BS–TBL (state 2) (i), and BS–DBL (state 2) (j). Cryo-EM density maps are shown as grey semi-transparent surfaces. The Mg2+ ions are depicted as cyan spheres. In (c), (d), (i), and (j), the density maps are contoured at two different levels. The top strand is partially religated at the RuvC.1–Tnp.4 active site in state 1 (green arrow) (c), whereas the top strand is fully religated at the RuvC.1–Tnp.4 active site in state 2 (cyan arrow) (e). The top strands are fully religated at the RuvC.3–Tnp.2 active site in states 1 and 2 (cyan arrows) (d, f). The bottom strands of tDNA and dDNA are not cleaved in state 1 (g, h). The bottom strand of tDNA is fully cleaved at the RuvC.2–Tnp.3 active site in state 2 (yellow arrow) (i), whereas that of dDNA is partially cleaved at the RuvC.4–Tnp.1 active site in state 2 (green arrow) (j). TS, top strand; BS, bottom strand.

