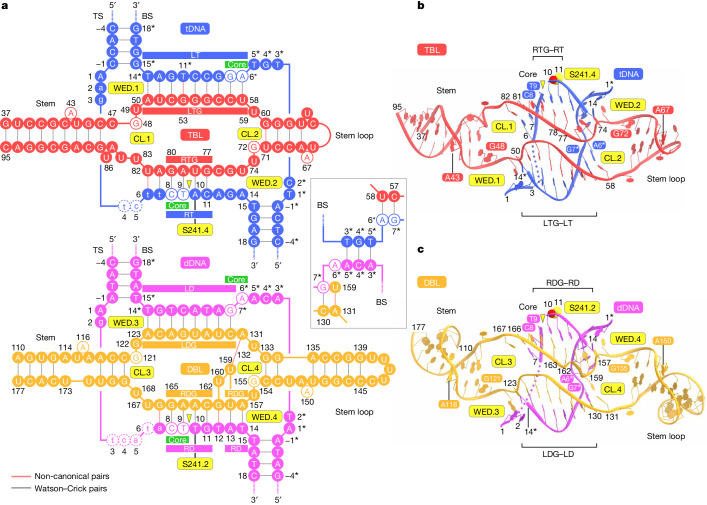
Fig. 2. bRNA architecture.
a, Schematics showing base pairing between the bRNA and tDNA (top) and bRNA and dDNA (bottom). The covalent 5′-phosphoserine–DNA linkages are indicated by grey lines. Non-canonical base pairing is indicated by red lines. Disordered nucleotides are indicated by dashed circles. The 5′ stem loop and the linker region are omitted. CL, catalytic loop; WED, hydrophobic wedge. b,c, Structures of TBL–tDNA (b) and DBL–dDNA (c). Disordered regions are indicated by dotted lines. The S241 residues are depicted as space-filling models. In a–c, DNA cleavage sites are indicated by yellow triangles.

