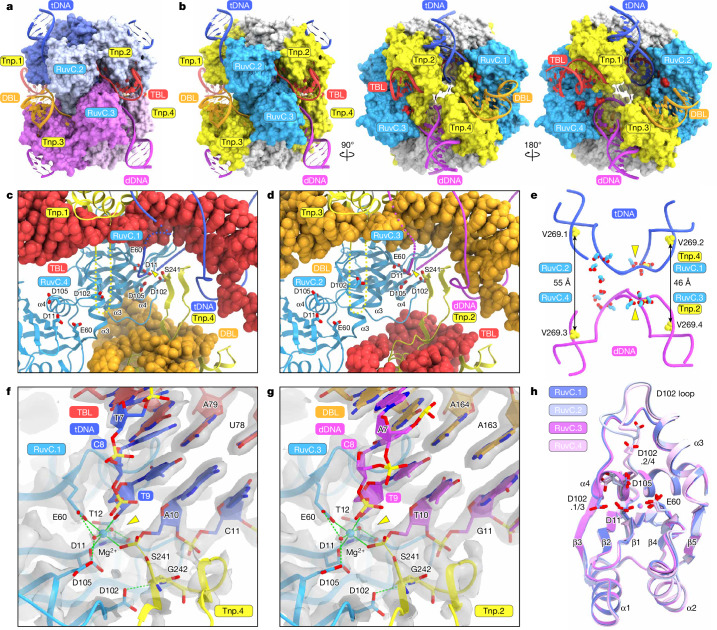
Fig. 3. Synaptic complex formation.
a,b, Surface representations of the IS621 synaptic complex, coloured according to the protomers (a) and domains (b). In b, the catalytic residues are coloured in red. c,d, Active sites formed by RuvC.1 and Tnp.4 (c) and RuvC.3 and Tnp.2 (d). The TBL and DBL are shown as space-filling models. DNA cleavage sites are indicated by yellow triangles. Disordered regions are indicated by dotted lines. e, Locations of the active sites relative to the tDNA and dDNA. f,g, Close-up views of the active sites formed by RuvC.1 and Tnp.4 (f) and RuvC.3 and Tnp.2 (g). Cryo-EM density maps are shown as grey semi-transparent surfaces. The Mg2+ ions and water molecules are depicted as cyan and red spheres, respectively. Hydrogen and coordinate bonds are shown as green dashed and solid lines, respectively. DNA cleavage sites are indicated by yellow triangles. h, Superimposition of the RuvC domains in the four IS621 protomers. The Mg2+ ions are depicted as spheres.

