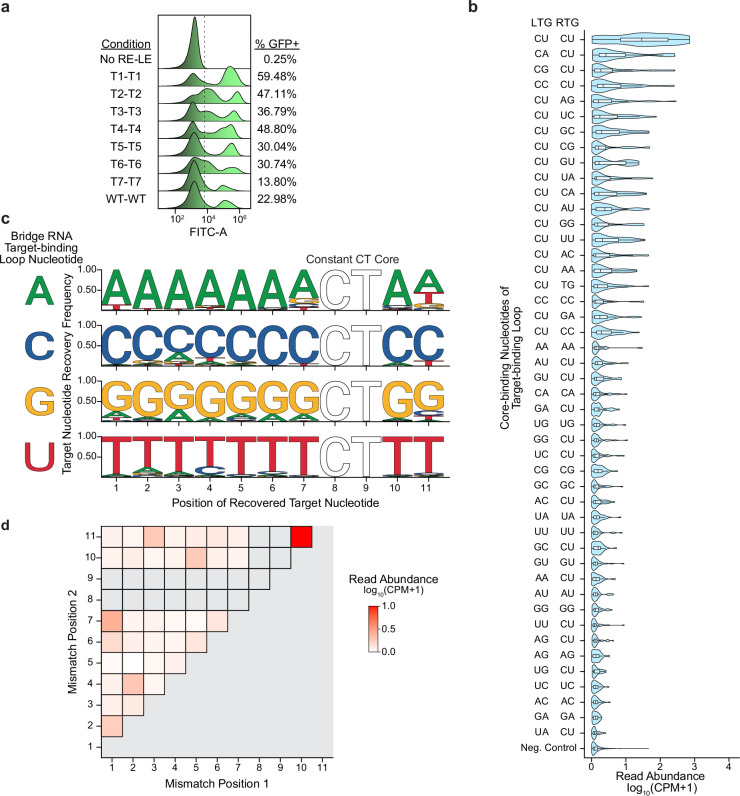
Extended Data Fig. 6. Extended results of RNA target-binding loop and target reprogramming.
a, DNA recombination in E. coli with reprogrammed bridge RNAs. The distribution of FITC-A signal for the cell population is shown, with a representative gating strategy for evaluating the percentage of GFP+ cells. T1-T1, T2-T2, etc., represents bridge RNA specificity and provided target, respectively. Plots are representative of 3 replicates featured in Fig. 3d. b, Read abundance of oligos with bridge RNA target-binding loop mutations at the positions that bind to the core sequence. The 2 base-pair nucleotides predicted to bind the core in the target-binding loop LTG and RTG were mutated while holding the target and donor CT cores constant and varying the 9 other programmable positions. All tested core mutation combinations shown were tested for 35 different targets, along with a negative control set (n = 1,000) of 9 mismatch target/target-binding loop combinations. c, Mismatch tolerance at each position of the 11 bp target sequence. The x-axis shows the target position, with the CT core held constant. The top panel shows the target nucleotide recovery frequency when the target-binding loop contains an A at each guide position, the second panel shows the same but when the target-binding loop contains a C at each position, etc. as a percentage of recovered recombinants at each position. d, Double-mismatch tolerance for combinations of positions within the target and target-binding loop. Each cell indicates the average read abundance of oligos that contain double mismatches at the two corresponding positions. The core was held constant. n = 800 double-mismatch combinations measured.

