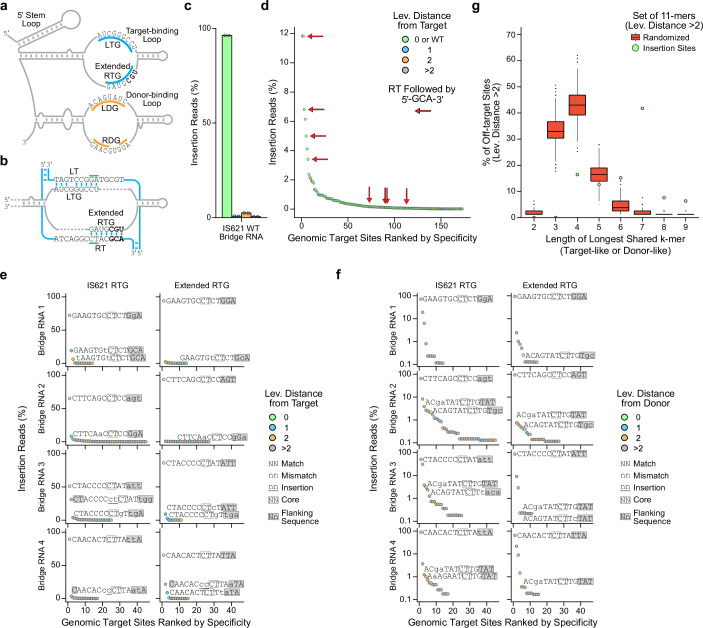
Extended Data Fig. 7. Effect of extended RTGs on the specificity of genome insertion by IS621 bridge RNA and recombinase.
a, Schematic indicating the bases of the WT bridge RNA which may represent an extended RTG. b, Schematic indicating how the target-binding loop of the WT bridge RNA can form more base pairs with a WT 11 bp target sequence flanked on the 5′ end by 5′-GCA-3′. c, Genomic specificity profile of the IS621 WT bridge RNAs. Colour indicates the number of differences from the intended sites as measured by Levenshtein distance. Data represent sums of all insertion sites with 0 or WT (ATCAGGCCTAC), 1, 2 or >2 differences from the expected target. d, Insertion sites into the E. coli genome ranked by abundance. Insertion sites where the RTG flanking bases match the RT flanking bases are indicated with red arrows. e, Genomic insertion sites for reprogrammed bridge RNAs displayed in rank order. High frequency insertion sites are highlighted by descriptions of similarity to the intended target sequence. Colour indicates the number of differences from the expected sites as measured by Levenshtein distance. f, Genomic insertion sites in e recoloured to represent similarity to the WT donor sequence. g, Similarity of off-target sites (Lev. distance > 2 from expected target and donor) to the expected target and donor sequences as measured by the length of the longest shared k-mer. For comparison, off-target sites were randomly shuffled and the procedure was repeated 1,000 times to generate a null distribution (box plots; showing median (centre line), IQR (box edges), 1.5 × IQR (whiskers) and outliers as points). Observed values are shown as blue points.

