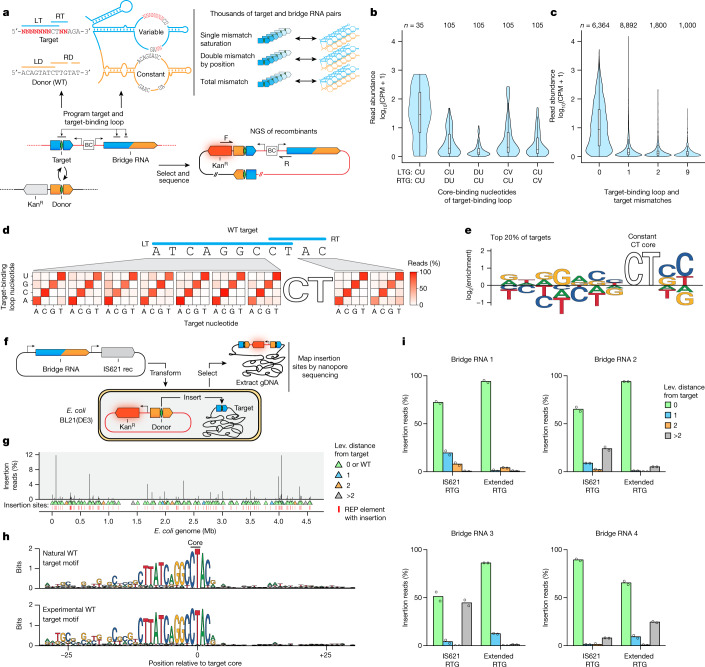
Fig. 4. High-throughput characterization of IS621 target specificity shows flexible programmability.
a, Schematic representation of the target specificity screen. Successful recombination enables the survival of E. coli through the expression of a kanamycin resistance cassette (KanR). The target sequence and bridge RNA are separated by a 12-nt barcode (BC). NGS, next-generation sequencing. b, Mismatch tolerance of the core dinucleotide. Core-binding nucleotides of the target-binding loop are summarized by IUPAC codes, including D (not C) and V (not U). Average counts per million (CPM) of two biological replicates. Box plots show median (centre line), IQR (box edges) and 1.5 × IQR (whiskers). c, Mismatch tolerance between non-core sequences of the target and target-binding loop. Average CPM of two biological replicates. Box plots show median (centre line), IQR (box edges) and 1.5 × IQR (whiskers). d, Mismatch tolerance between target and target-binding loop, as indicated by the percentage of total detected recombinants carrying each nucleotide at each position. Average of two biological replicates. e, Nucleotide enrichment among the top 20% most efficient matched pairs of targets and target-binding loops. f, Schematic of the genome insertion assay in E. coli. g, Genome-wide mapping of insertions mediated by the WT IS621 bridge RNA. The percentage of total reads mapped to each insertion site is depicted and binned by the number of differences from the intended sites as measured by Levenshtein distance. Average of two biological replicates. h, Target site preference of IS621. Sequence logos depict the target site motifs among natural (top, Methods) and experimentally observed (bottom, Fig. 4g) IS621 target sites. i, Genomic specificity profile of four reprogrammed bridge RNAs. Two biological replicates.

